Immigrants from Western Africa vs Immigrants from Netherlands Average Family Size
COMPARE
Immigrants from Western Africa
Immigrants from Netherlands
Average Family Size
Average Family Size Comparison
Immigrants from Western Africa
Immigrants from Netherlands
3.29
AVERAGE FAMILY SIZE
98.4/ 100
METRIC RATING
103rd/ 347
METRIC RANK
3.14
AVERAGE FAMILY SIZE
0.3/ 100
METRIC RATING
286th/ 347
METRIC RANK
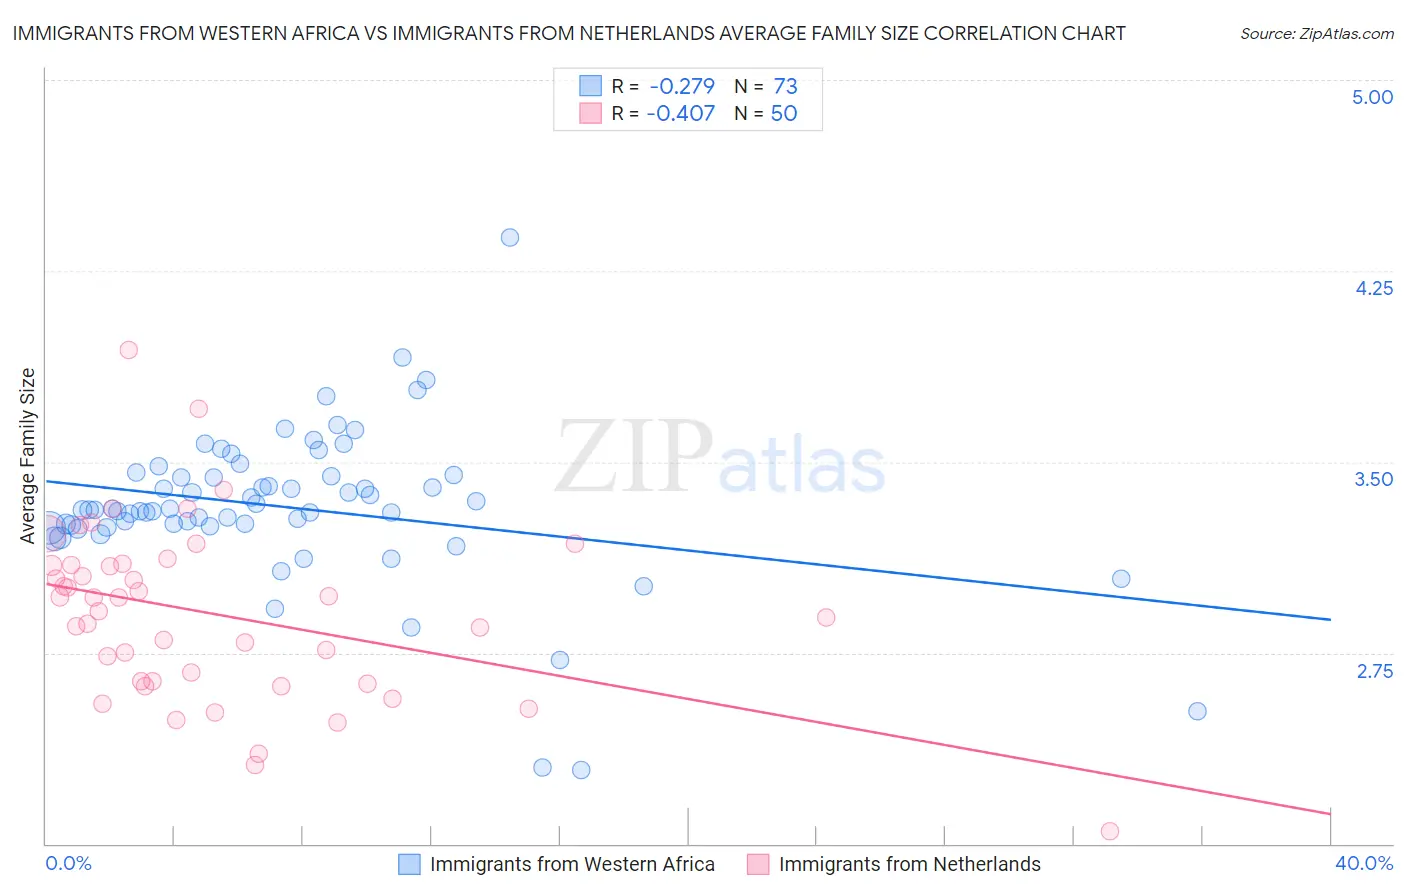
Immigrants from Western Africa vs Immigrants from Netherlands Average Family Size Correlation Chart
The statistical analysis conducted on geographies consisting of 357,548,520 people shows a weak negative correlation between the proportion of Immigrants from Western Africa and average family size in the United States with a correlation coefficient (R) of -0.279 and weighted average of 3.29. Similarly, the statistical analysis conducted on geographies consisting of 237,802,006 people shows a moderate negative correlation between the proportion of Immigrants from Netherlands and average family size in the United States with a correlation coefficient (R) of -0.407 and weighted average of 3.14, a difference of 4.7%.
Average Family Size Correlation Summary
| Measurement | Immigrants from Western Africa | Immigrants from Netherlands |
| Minimum | 2.29 | 2.05 |
| Maximum | 4.38 | 3.94 |
| Range | 2.09 | 1.89 |
| Mean | 3.32 | 2.90 |
| Median | 3.31 | 2.94 |
| Interquartile 25% (IQ1) | 3.24 | 2.64 |
| Interquartile 75% (IQ3) | 3.45 | 3.09 |
| Interquartile Range (IQR) | 0.20 | 0.46 |
| Standard Deviation (Sample) | 0.31 | 0.35 |
| Standard Deviation (Population) | 0.31 | 0.34 |
Similar Demographics by Average Family Size
Demographics Similar to Immigrants from Western Africa by Average Family Size
In terms of average family size, the demographic groups most similar to Immigrants from Western Africa are West Indian (3.29, a difference of 0.030%), Immigrants from Burma/Myanmar (3.29, a difference of 0.040%), Bolivian (3.29, a difference of 0.040%), Guamanian/Chamorro (3.29, a difference of 0.050%), and Immigrants from Oceania (3.29, a difference of 0.060%).
| Demographics | Rating | Rank | Average Family Size |
| U.S. Virgin Islanders | 98.8 /100 | #96 | Exceptional 3.29 |
| Immigrants | Oceania | 98.7 /100 | #97 | Exceptional 3.29 |
| Barbadians | 98.6 /100 | #98 | Exceptional 3.29 |
| Nigerians | 98.6 /100 | #99 | Exceptional 3.29 |
| Guamanians/Chamorros | 98.6 /100 | #100 | Exceptional 3.29 |
| Immigrants | Burma/Myanmar | 98.6 /100 | #101 | Exceptional 3.29 |
| West Indians | 98.5 /100 | #102 | Exceptional 3.29 |
| Immigrants | Western Africa | 98.4 /100 | #103 | Exceptional 3.29 |
| Bolivians | 98.3 /100 | #104 | Exceptional 3.29 |
| Immigrants | Ghana | 98.1 /100 | #105 | Exceptional 3.29 |
| Paiute | 98.0 /100 | #106 | Exceptional 3.29 |
| Ghanaians | 98.0 /100 | #107 | Exceptional 3.29 |
| Asians | 97.0 /100 | #108 | Exceptional 3.28 |
| Puerto Ricans | 96.7 /100 | #109 | Exceptional 3.28 |
| Bahamians | 96.6 /100 | #110 | Exceptional 3.28 |
Demographics Similar to Immigrants from Netherlands by Average Family Size
In terms of average family size, the demographic groups most similar to Immigrants from Netherlands are Greek (3.14, a difference of 0.010%), Immigrants from Czechoslovakia (3.14, a difference of 0.010%), Immigrants from Norway (3.14, a difference of 0.010%), Cypriot (3.14, a difference of 0.040%), and White/Caucasian (3.14, a difference of 0.050%).
| Demographics | Rating | Rank | Average Family Size |
| Immigrants | Europe | 0.5 /100 | #279 | Tragic 3.15 |
| Immigrants | England | 0.4 /100 | #280 | Tragic 3.15 |
| Immigrants | Denmark | 0.4 /100 | #281 | Tragic 3.15 |
| Yugoslavians | 0.4 /100 | #282 | Tragic 3.15 |
| German Russians | 0.4 /100 | #283 | Tragic 3.15 |
| Immigrants | France | 0.4 /100 | #284 | Tragic 3.15 |
| Whites/Caucasians | 0.3 /100 | #285 | Tragic 3.14 |
| Immigrants | Netherlands | 0.3 /100 | #286 | Tragic 3.14 |
| Greeks | 0.3 /100 | #287 | Tragic 3.14 |
| Immigrants | Czechoslovakia | 0.3 /100 | #288 | Tragic 3.14 |
| Immigrants | Norway | 0.3 /100 | #289 | Tragic 3.14 |
| Cypriots | 0.3 /100 | #290 | Tragic 3.14 |
| Alsatians | 0.2 /100 | #291 | Tragic 3.14 |
| Europeans | 0.2 /100 | #292 | Tragic 3.14 |
| Scandinavians | 0.2 /100 | #293 | Tragic 3.14 |