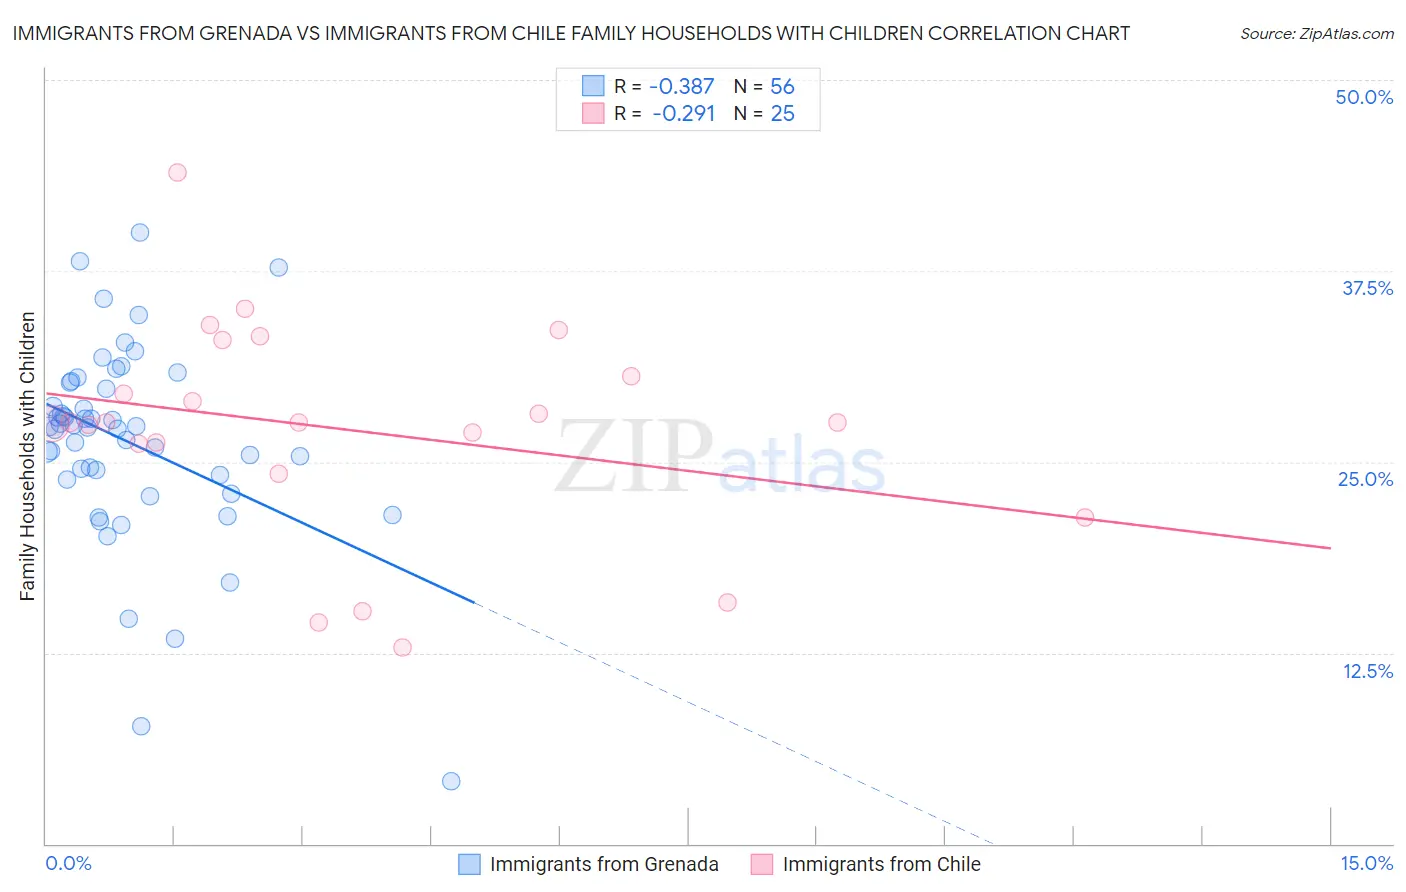
Immigrants from Grenada vs Immigrants from Chile Family Households with Children
COMPARE
Immigrants from Grenada
Immigrants from Chile
Family Households with Children
Family Households with Children Comparison
Immigrants from Grenada
Immigrants from Chile
25.2%
FAMILY HOUSEHOLDS WITH CHILDREN
0.0/ 100
METRIC RATING
345th/ 347
METRIC RANK
27.7%
FAMILY HOUSEHOLDS WITH CHILDREN
79.5/ 100
METRIC RATING
145th/ 347
METRIC RANK
Immigrants from Grenada vs Immigrants from Chile Family Households with Children Correlation Chart
The statistical analysis conducted on geographies consisting of 67,175,272 people shows a mild negative correlation between the proportion of Immigrants from Grenada and percentage of family households with children in the United States with a correlation coefficient (R) of -0.387 and weighted average of 25.2%. Similarly, the statistical analysis conducted on geographies consisting of 218,581,482 people shows a weak negative correlation between the proportion of Immigrants from Chile and percentage of family households with children in the United States with a correlation coefficient (R) of -0.291 and weighted average of 27.7%, a difference of 9.9%.
Family Households with Children Correlation Summary
| Measurement | Immigrants from Grenada | Immigrants from Chile |
| Minimum | 4.1% | 12.9% |
| Maximum | 40.0% | 44.0% |
| Range | 35.9% | 31.1% |
| Mean | 26.3% | 27.1% |
| Median | 27.3% | 27.6% |
| Interquartile 25% (IQ1) | 24.0% | 25.2% |
| Interquartile 75% (IQ3) | 30.0% | 31.8% |
| Interquartile Range (IQR) | 6.0% | 6.6% |
| Standard Deviation (Sample) | 6.5% | 7.1% |
| Standard Deviation (Population) | 6.4% | 7.0% |
Similar Demographics by Family Households with Children
Demographics Similar to Immigrants from Grenada by Family Households with Children
In terms of family households with children, the demographic groups most similar to Immigrants from Grenada are Carpatho Rusyn (25.2%, a difference of 0.0%), Pueblo (25.2%, a difference of 0.18%), Hopi (25.2%, a difference of 0.28%), Alsatian (25.3%, a difference of 0.44%), and Immigrants from Serbia (25.5%, a difference of 1.1%).
| Demographics | Rating | Rank | Family Households with Children |
| Immigrants | Switzerland | 0.0 /100 | #333 | Tragic 25.7% |
| Slovaks | 0.0 /100 | #334 | Tragic 25.7% |
| Immigrants | Croatia | 0.0 /100 | #335 | Tragic 25.7% |
| Immigrants | West Indies | 0.0 /100 | #336 | Tragic 25.7% |
| Puerto Ricans | 0.0 /100 | #337 | Tragic 25.6% |
| Arapaho | 0.0 /100 | #338 | Tragic 25.6% |
| Immigrants | St. Vincent and the Grenadines | 0.0 /100 | #339 | Tragic 25.6% |
| Immigrants | Armenia | 0.0 /100 | #340 | Tragic 25.6% |
| Immigrants | Serbia | 0.0 /100 | #341 | Tragic 25.5% |
| Alsatians | 0.0 /100 | #342 | Tragic 25.3% |
| Hopi | 0.0 /100 | #343 | Tragic 25.2% |
| Pueblo | 0.0 /100 | #344 | Tragic 25.2% |
| Immigrants | Grenada | 0.0 /100 | #345 | Tragic 25.2% |
| Carpatho Rusyns | 0.0 /100 | #346 | Tragic 25.2% |
| Soviet Union | 0.0 /100 | #347 | Tragic 24.8% |
Demographics Similar to Immigrants from Chile by Family Households with Children
In terms of family households with children, the demographic groups most similar to Immigrants from Chile are Basque (27.7%, a difference of 0.0%), Brazilian (27.7%, a difference of 0.010%), Immigrants from Moldova (27.6%, a difference of 0.010%), Osage (27.6%, a difference of 0.020%), and Menominee (27.6%, a difference of 0.020%).
| Demographics | Rating | Rank | Family Households with Children |
| Uruguayans | 83.2 /100 | #138 | Excellent 27.7% |
| Vietnamese | 82.6 /100 | #139 | Excellent 27.7% |
| Spanish | 81.8 /100 | #140 | Excellent 27.7% |
| Immigrants | Eastern Asia | 81.7 /100 | #141 | Excellent 27.7% |
| Swiss | 81.4 /100 | #142 | Excellent 27.7% |
| Immigrants | Eastern Africa | 80.2 /100 | #143 | Excellent 27.7% |
| Brazilians | 79.6 /100 | #144 | Good 27.7% |
| Immigrants | Chile | 79.5 /100 | #145 | Good 27.7% |
| Basques | 79.5 /100 | #146 | Good 27.7% |
| Immigrants | Moldova | 79.1 /100 | #147 | Good 27.6% |
| Osage | 79.0 /100 | #148 | Good 27.6% |
| Menominee | 78.9 /100 | #149 | Good 27.6% |
| Argentineans | 78.5 /100 | #150 | Good 27.6% |
| Portuguese | 77.8 /100 | #151 | Good 27.6% |
| Ethiopians | 77.0 /100 | #152 | Good 27.6% |