Nicaraguan vs Hispanic or Latino Family Households with Children
COMPARE
Nicaraguan
Hispanic or Latino
Family Households with Children
Family Households with Children Comparison
Nicaraguans
Hispanics or Latinos
28.4%
FAMILY HOUSEHOLDS WITH CHILDREN
99.8/ 100
METRIC RATING
83rd/ 347
METRIC RANK
29.9%
FAMILY HOUSEHOLDS WITH CHILDREN
100.0/ 100
METRIC RATING
17th/ 347
METRIC RANK
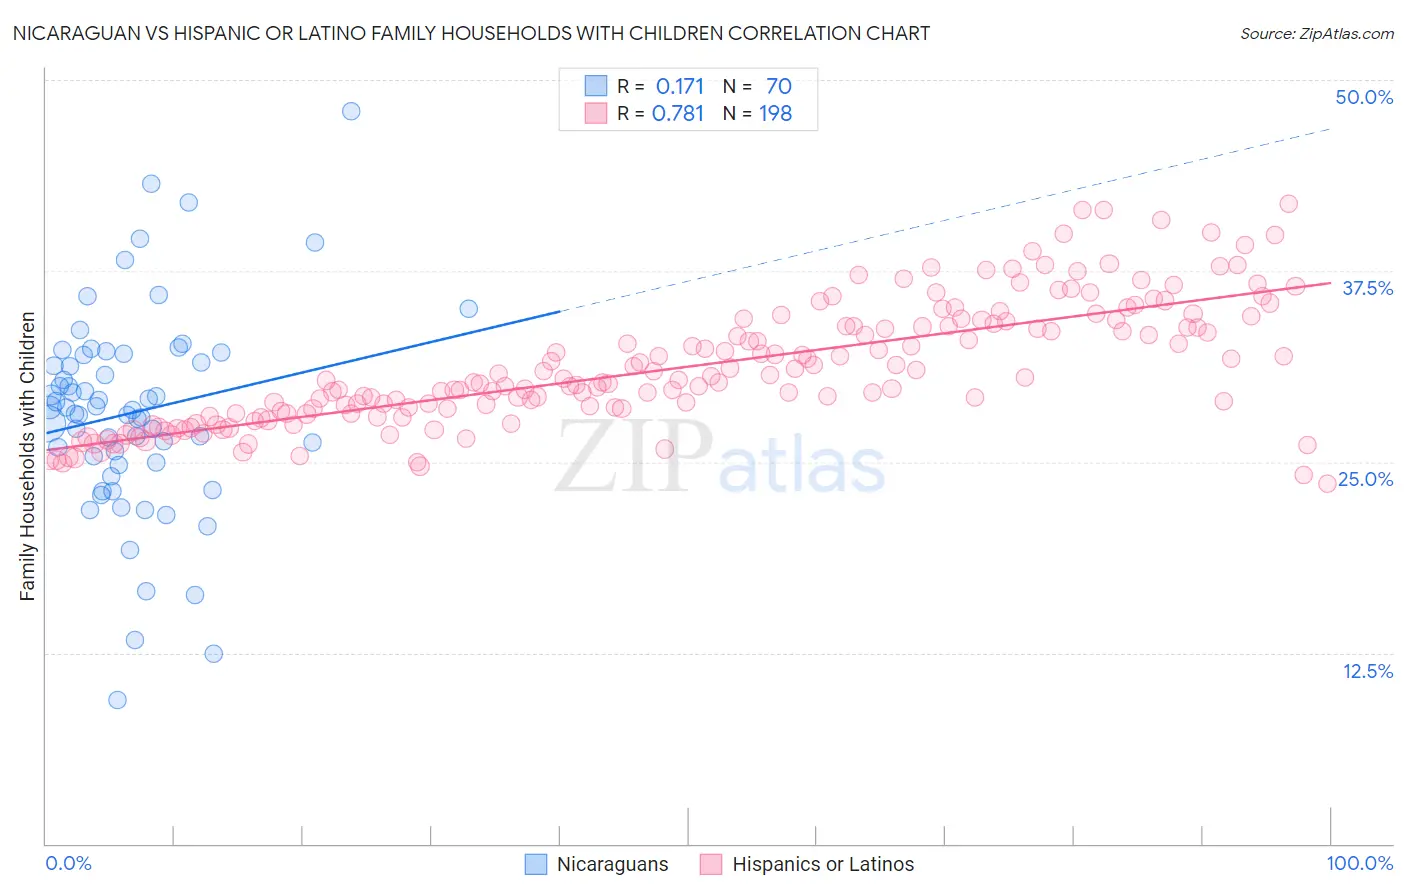
Nicaraguan vs Hispanic or Latino Family Households with Children Correlation Chart
The statistical analysis conducted on geographies consisting of 285,584,121 people shows a poor positive correlation between the proportion of Nicaraguans and percentage of family households with children in the United States with a correlation coefficient (R) of 0.171 and weighted average of 28.4%. Similarly, the statistical analysis conducted on geographies consisting of 574,333,059 people shows a strong positive correlation between the proportion of Hispanics or Latinos and percentage of family households with children in the United States with a correlation coefficient (R) of 0.781 and weighted average of 29.9%, a difference of 5.4%.
Family Households with Children Correlation Summary
| Measurement | Nicaraguan | Hispanic or Latino |
| Minimum | 9.4% | 23.6% |
| Maximum | 47.9% | 41.9% |
| Range | 38.5% | 18.3% |
| Mean | 28.2% | 31.2% |
| Median | 28.5% | 30.3% |
| Interquartile 25% (IQ1) | 25.0% | 28.2% |
| Interquartile 75% (IQ3) | 32.0% | 33.9% |
| Interquartile Range (IQR) | 7.0% | 5.8% |
| Standard Deviation (Sample) | 6.7% | 4.0% |
| Standard Deviation (Population) | 6.7% | 4.0% |
Similar Demographics by Family Households with Children
Demographics Similar to Nicaraguans by Family Households with Children
In terms of family households with children, the demographic groups most similar to Nicaraguans are Costa Rican (28.4%, a difference of 0.0%), Immigrants from Syria (28.4%, a difference of 0.020%), Kenyan (28.4%, a difference of 0.050%), South American (28.4%, a difference of 0.090%), and Native/Alaskan (28.4%, a difference of 0.12%).
| Demographics | Rating | Rank | Family Households with Children |
| Immigrants | Sri Lanka | 99.9 /100 | #76 | Exceptional 28.4% |
| Nigerians | 99.8 /100 | #77 | Exceptional 28.4% |
| Immigrants | Nepal | 99.8 /100 | #78 | Exceptional 28.4% |
| Immigrants | Iraq | 99.8 /100 | #79 | Exceptional 28.4% |
| Natives/Alaskans | 99.8 /100 | #80 | Exceptional 28.4% |
| South Americans | 99.8 /100 | #81 | Exceptional 28.4% |
| Kenyans | 99.8 /100 | #82 | Exceptional 28.4% |
| Nicaraguans | 99.8 /100 | #83 | Exceptional 28.4% |
| Costa Ricans | 99.8 /100 | #84 | Exceptional 28.4% |
| Immigrants | Syria | 99.8 /100 | #85 | Exceptional 28.4% |
| Immigrants | Western Africa | 99.6 /100 | #86 | Exceptional 28.3% |
| Colombians | 99.6 /100 | #87 | Exceptional 28.3% |
| Liberians | 99.6 /100 | #88 | Exceptional 28.3% |
| Immigrants | Costa Rica | 99.6 /100 | #89 | Exceptional 28.3% |
| Immigrants | Thailand | 99.5 /100 | #90 | Exceptional 28.2% |
Demographics Similar to Hispanics or Latinos by Family Households with Children
In terms of family households with children, the demographic groups most similar to Hispanics or Latinos are Salvadoran (29.9%, a difference of 0.19%), Alaska Native (29.9%, a difference of 0.22%), Immigrants from El Salvador (29.8%, a difference of 0.25%), Immigrants from Laos (29.8%, a difference of 0.30%), and Malaysian (29.8%, a difference of 0.33%).
| Demographics | Rating | Rank | Family Households with Children |
| Immigrants | Fiji | 100.0 /100 | #10 | Exceptional 30.5% |
| Nepalese | 100.0 /100 | #11 | Exceptional 30.5% |
| Immigrants | Pakistan | 100.0 /100 | #12 | Exceptional 30.2% |
| Afghans | 100.0 /100 | #13 | Exceptional 30.2% |
| Bangladeshis | 100.0 /100 | #14 | Exceptional 30.1% |
| Immigrants | South Central Asia | 100.0 /100 | #15 | Exceptional 30.0% |
| Immigrants | Afghanistan | 100.0 /100 | #16 | Exceptional 30.0% |
| Hispanics or Latinos | 100.0 /100 | #17 | Exceptional 29.9% |
| Salvadorans | 100.0 /100 | #18 | Exceptional 29.9% |
| Alaska Natives | 100.0 /100 | #19 | Exceptional 29.9% |
| Immigrants | El Salvador | 100.0 /100 | #20 | Exceptional 29.8% |
| Immigrants | Laos | 100.0 /100 | #21 | Exceptional 29.8% |
| Malaysians | 100.0 /100 | #22 | Exceptional 29.8% |
| Mexican American Indians | 100.0 /100 | #23 | Exceptional 29.7% |
| Guamanians/Chamorros | 100.0 /100 | #24 | Exceptional 29.7% |