Black/African American vs Alaska Native Single Mother Households
COMPARE
Black/African American
Alaska Native
Single Mother Households
Single Mother Households Comparison
Blacks/African Americans
Alaska Natives
9.0%
SINGLE MOTHER HOUSEHOLDS
0.0/ 100
METRIC RATING
339th/ 347
METRIC RANK
7.4%
SINGLE MOTHER HOUSEHOLDS
0.2/ 100
METRIC RATING
257th/ 347
METRIC RANK
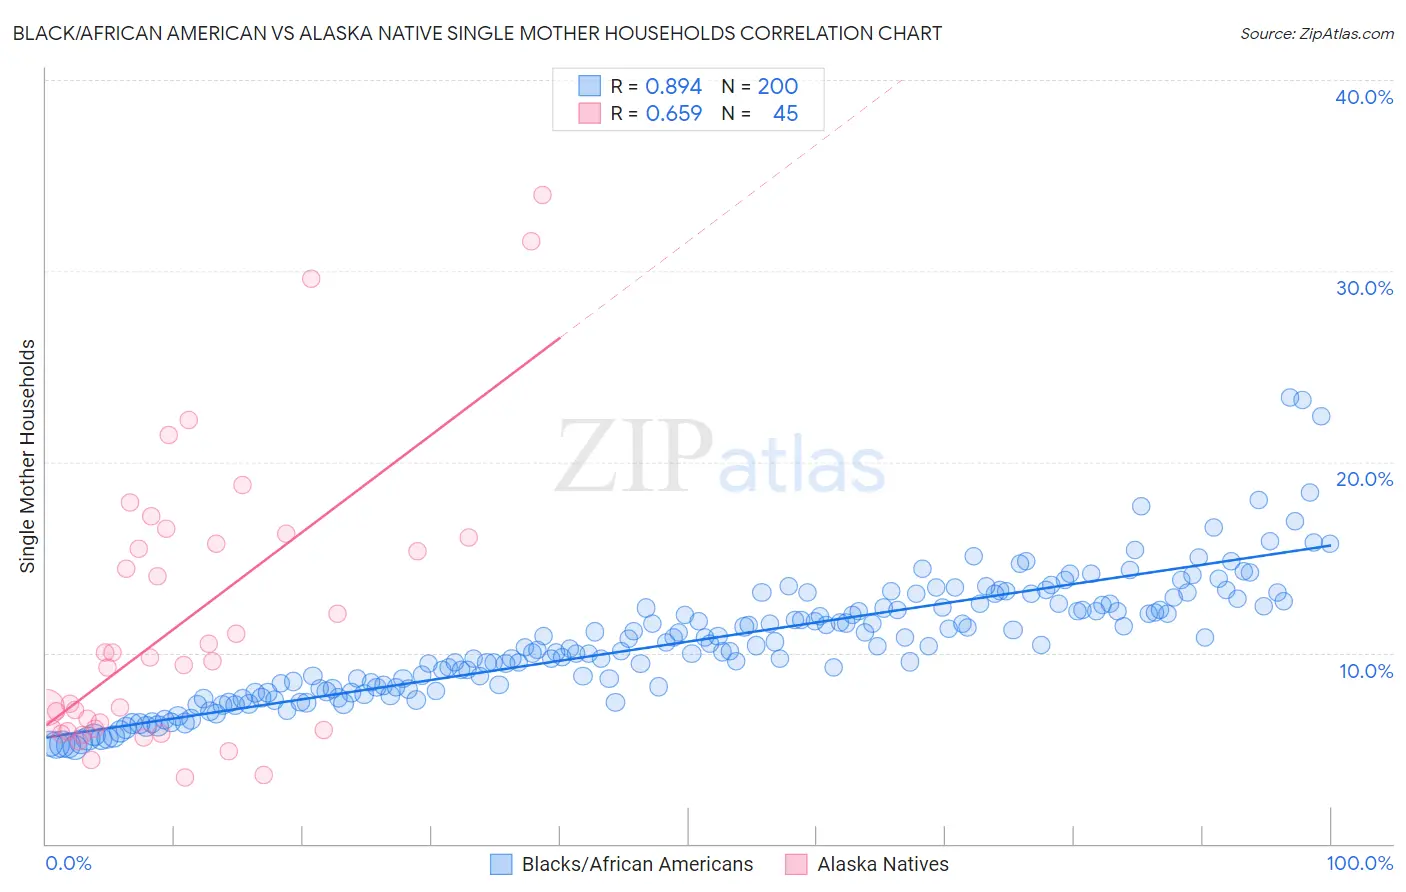
Black/African American vs Alaska Native Single Mother Households Correlation Chart
The statistical analysis conducted on geographies consisting of 561,713,889 people shows a very strong positive correlation between the proportion of Blacks/African Americans and percentage of single mother households in the United States with a correlation coefficient (R) of 0.894 and weighted average of 9.0%. Similarly, the statistical analysis conducted on geographies consisting of 76,685,666 people shows a significant positive correlation between the proportion of Alaska Natives and percentage of single mother households in the United States with a correlation coefficient (R) of 0.659 and weighted average of 7.4%, a difference of 21.5%.
Single Mother Households Correlation Summary
| Measurement | Black/African American | Alaska Native |
| Minimum | 5.1% | 3.4% |
| Maximum | 23.4% | 34.0% |
| Range | 18.3% | 30.6% |
| Mean | 10.6% | 11.7% |
| Median | 10.4% | 9.6% |
| Interquartile 25% (IQ1) | 8.1% | 6.0% |
| Interquartile 75% (IQ3) | 12.5% | 15.9% |
| Interquartile Range (IQR) | 4.4% | 9.9% |
| Standard Deviation (Sample) | 3.3% | 7.4% |
| Standard Deviation (Population) | 3.2% | 7.3% |
Similar Demographics by Single Mother Households
Demographics Similar to Blacks/African Americans by Single Mother Households
In terms of single mother households, the demographic groups most similar to Blacks/African Americans are Lumbee (9.1%, a difference of 1.2%), Cape Verdean (8.9%, a difference of 1.5%), Tohono O'odham (9.1%, a difference of 1.6%), Navajo (8.8%, a difference of 1.7%), and Menominee (9.2%, a difference of 1.9%).
| Demographics | Rating | Rank | Single Mother Households |
| U.S. Virgin Islanders | 0.0 /100 | #332 | Tragic 8.6% |
| Liberians | 0.0 /100 | #333 | Tragic 8.6% |
| Immigrants | Liberia | 0.0 /100 | #334 | Tragic 8.7% |
| Immigrants | Dominica | 0.0 /100 | #335 | Tragic 8.7% |
| Puerto Ricans | 0.0 /100 | #336 | Tragic 8.7% |
| Navajo | 0.0 /100 | #337 | Tragic 8.8% |
| Cape Verdeans | 0.0 /100 | #338 | Tragic 8.9% |
| Blacks/African Americans | 0.0 /100 | #339 | Tragic 9.0% |
| Lumbee | 0.0 /100 | #340 | Tragic 9.1% |
| Tohono O'odham | 0.0 /100 | #341 | Tragic 9.1% |
| Menominee | 0.0 /100 | #342 | Tragic 9.2% |
| Dominicans | 0.0 /100 | #343 | Tragic 9.2% |
| Immigrants | Dominican Republic | 0.0 /100 | #344 | Tragic 9.5% |
| Immigrants | Cabo Verde | 0.0 /100 | #345 | Tragic 9.6% |
| Yuman | 0.0 /100 | #346 | Tragic 9.6% |
Demographics Similar to Alaska Natives by Single Mother Households
In terms of single mother households, the demographic groups most similar to Alaska Natives are Pueblo (7.4%, a difference of 0.020%), Seminole (7.4%, a difference of 0.040%), Immigrants from Yemen (7.4%, a difference of 0.040%), Immigrants from Zaire (7.4%, a difference of 0.080%), and Japanese (7.4%, a difference of 0.10%).
| Demographics | Rating | Rank | Single Mother Households |
| Immigrants | Africa | 0.4 /100 | #250 | Tragic 7.3% |
| Malaysians | 0.3 /100 | #251 | Tragic 7.3% |
| Alaskan Athabascans | 0.3 /100 | #252 | Tragic 7.3% |
| Cajuns | 0.3 /100 | #253 | Tragic 7.3% |
| Immigrants | Ecuador | 0.3 /100 | #254 | Tragic 7.3% |
| Mexican American Indians | 0.2 /100 | #255 | Tragic 7.4% |
| Seminole | 0.2 /100 | #256 | Tragic 7.4% |
| Alaska Natives | 0.2 /100 | #257 | Tragic 7.4% |
| Pueblo | 0.2 /100 | #258 | Tragic 7.4% |
| Immigrants | Yemen | 0.2 /100 | #259 | Tragic 7.4% |
| Immigrants | Zaire | 0.2 /100 | #260 | Tragic 7.4% |
| Japanese | 0.2 /100 | #261 | Tragic 7.4% |
| Immigrants | Somalia | 0.2 /100 | #262 | Tragic 7.4% |
| Immigrants | Nicaragua | 0.2 /100 | #263 | Tragic 7.4% |
| Yaqui | 0.1 /100 | #264 | Tragic 7.4% |