Ukrainian vs Alaska Native Average Family Size
COMPARE
Ukrainian
Alaska Native
Average Family Size
Average Family Size Comparison
Ukrainians
Alaska Natives
3.14
AVERAGE FAMILY SIZE
0.2/ 100
METRIC RATING
296th/ 347
METRIC RANK
3.37
AVERAGE FAMILY SIZE
100.0/ 100
METRIC RATING
44th/ 347
METRIC RANK
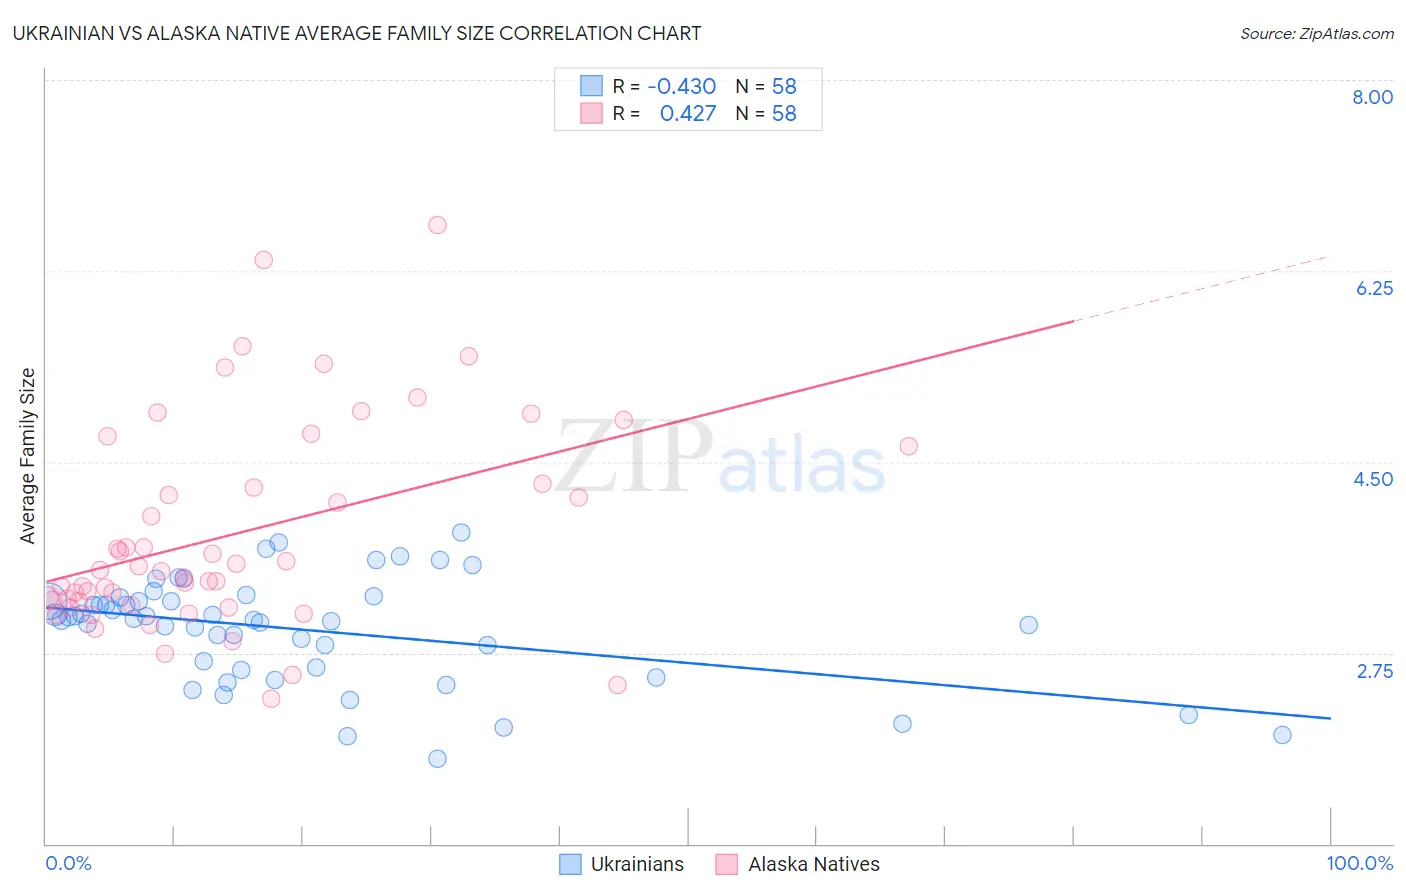
Ukrainian vs Alaska Native Average Family Size Correlation Chart
The statistical analysis conducted on geographies consisting of 448,324,069 people shows a moderate negative correlation between the proportion of Ukrainians and average family size in the United States with a correlation coefficient (R) of -0.430 and weighted average of 3.14. Similarly, the statistical analysis conducted on geographies consisting of 76,756,389 people shows a moderate positive correlation between the proportion of Alaska Natives and average family size in the United States with a correlation coefficient (R) of 0.427 and weighted average of 3.37, a difference of 7.5%.
Average Family Size Correlation Summary
| Measurement | Ukrainian | Alaska Native |
| Minimum | 1.78 | 2.33 |
| Maximum | 3.85 | 6.67 |
| Range | 2.07 | 4.34 |
| Mean | 2.96 | 3.83 |
| Median | 3.06 | 3.50 |
| Interquartile 25% (IQ1) | 2.62 | 3.22 |
| Interquartile 75% (IQ3) | 3.22 | 4.30 |
| Interquartile Range (IQR) | 0.60 | 1.08 |
| Standard Deviation (Sample) | 0.48 | 0.95 |
| Standard Deviation (Population) | 0.47 | 0.94 |
Similar Demographics by Average Family Size
Demographics Similar to Ukrainians by Average Family Size
In terms of average family size, the demographic groups most similar to Ukrainians are Austrian (3.14, a difference of 0.0%), Immigrants from Western Europe (3.14, a difference of 0.0%), Immigrants from Croatia (3.14, a difference of 0.010%), Colville (3.14, a difference of 0.010%), and European (3.14, a difference of 0.030%).
| Demographics | Rating | Rank | Average Family Size |
| Immigrants | Norway | 0.3 /100 | #289 | Tragic 3.14 |
| Cypriots | 0.3 /100 | #290 | Tragic 3.14 |
| Alsatians | 0.2 /100 | #291 | Tragic 3.14 |
| Europeans | 0.2 /100 | #292 | Tragic 3.14 |
| Scandinavians | 0.2 /100 | #293 | Tragic 3.14 |
| Immigrants | Croatia | 0.2 /100 | #294 | Tragic 3.14 |
| Austrians | 0.2 /100 | #295 | Tragic 3.14 |
| Ukrainians | 0.2 /100 | #296 | Tragic 3.14 |
| Immigrants | Western Europe | 0.2 /100 | #297 | Tragic 3.14 |
| Colville | 0.2 /100 | #298 | Tragic 3.14 |
| Canadians | 0.2 /100 | #299 | Tragic 3.14 |
| Immigrants | Sweden | 0.2 /100 | #300 | Tragic 3.14 |
| Macedonians | 0.2 /100 | #301 | Tragic 3.13 |
| Immigrants | Latvia | 0.2 /100 | #302 | Tragic 3.13 |
| British | 0.2 /100 | #303 | Tragic 3.13 |
Demographics Similar to Alaska Natives by Average Family Size
In terms of average family size, the demographic groups most similar to Alaska Natives are Immigrants from Philippines (3.37, a difference of 0.010%), Shoshone (3.37, a difference of 0.030%), Haitian (3.37, a difference of 0.090%), Immigrants from Vietnam (3.38, a difference of 0.11%), and Vietnamese (3.37, a difference of 0.13%).
| Demographics | Rating | Rank | Average Family Size |
| Guyanese | 100.0 /100 | #37 | Exceptional 3.40 |
| Immigrants | Belize | 100.0 /100 | #38 | Exceptional 3.39 |
| Immigrants | Haiti | 100.0 /100 | #39 | Exceptional 3.39 |
| Belizeans | 100.0 /100 | #40 | Exceptional 3.39 |
| Marshallese | 100.0 /100 | #41 | Exceptional 3.38 |
| Immigrants | Vietnam | 100.0 /100 | #42 | Exceptional 3.38 |
| Immigrants | Philippines | 100.0 /100 | #43 | Exceptional 3.37 |
| Alaska Natives | 100.0 /100 | #44 | Exceptional 3.37 |
| Shoshone | 100.0 /100 | #45 | Exceptional 3.37 |
| Haitians | 100.0 /100 | #46 | Exceptional 3.37 |
| Vietnamese | 100.0 /100 | #47 | Exceptional 3.37 |
| Immigrants | Nicaragua | 100.0 /100 | #48 | Exceptional 3.37 |
| Bangladeshis | 100.0 /100 | #49 | Exceptional 3.37 |
| Immigrants | Bangladesh | 100.0 /100 | #50 | Exceptional 3.36 |
| Nicaraguans | 100.0 /100 | #51 | Exceptional 3.36 |