Blackfeet vs Immigrants from Germany Family Households
COMPARE
Blackfeet
Immigrants from Germany
Family Households
Family Households Comparison
Blackfeet
Immigrants from Germany
63.6%
FAMILY HOUSEHOLDS
3.6/ 100
METRIC RATING
228th/ 347
METRIC RANK
64.3%
FAMILY HOUSEHOLDS
50.0/ 100
METRIC RATING
174th/ 347
METRIC RANK
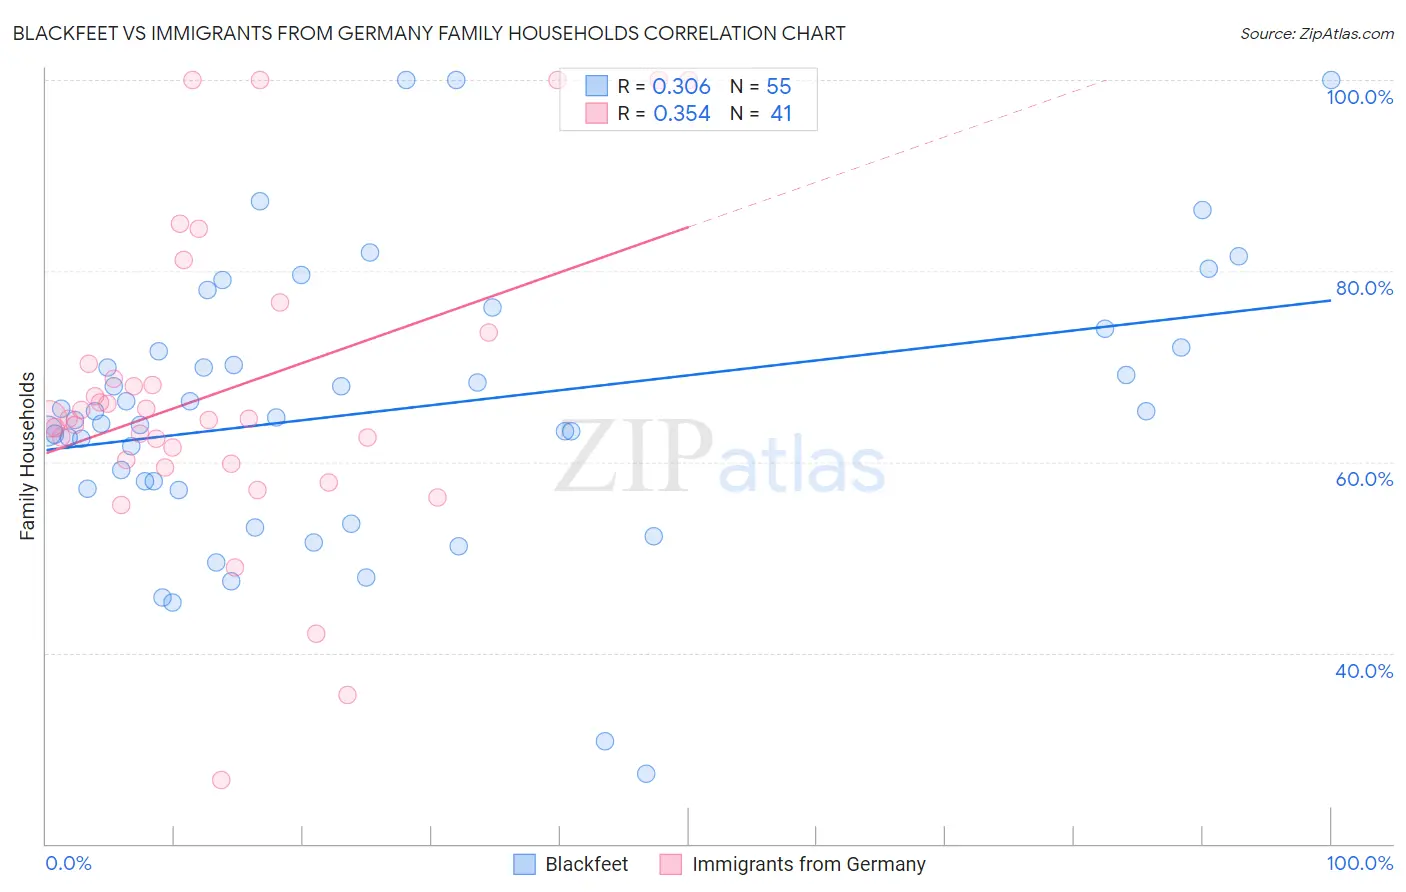
Blackfeet vs Immigrants from Germany Family Households Correlation Chart
The statistical analysis conducted on geographies consisting of 309,476,715 people shows a mild positive correlation between the proportion of Blackfeet and percentage of family households in the United States with a correlation coefficient (R) of 0.306 and weighted average of 63.6%. Similarly, the statistical analysis conducted on geographies consisting of 463,759,917 people shows a mild positive correlation between the proportion of Immigrants from Germany and percentage of family households in the United States with a correlation coefficient (R) of 0.354 and weighted average of 64.3%, a difference of 1.1%.
Family Households Correlation Summary
| Measurement | Blackfeet | Immigrants from Germany |
| Minimum | 27.3% | 26.7% |
| Maximum | 100.0% | 100.0% |
| Range | 72.7% | 73.3% |
| Mean | 65.5% | 67.4% |
| Median | 64.6% | 64.5% |
| Interquartile 25% (IQ1) | 57.2% | 60.0% |
| Interquartile 75% (IQ3) | 72.0% | 71.9% |
| Interquartile Range (IQR) | 14.9% | 11.9% |
| Standard Deviation (Sample) | 14.7% | 16.4% |
| Standard Deviation (Population) | 14.6% | 16.2% |
Similar Demographics by Family Households
Demographics Similar to Blackfeet by Family Households
In terms of family households, the demographic groups most similar to Blackfeet are Bulgarian (63.6%, a difference of 0.020%), Trinidadian and Tobagonian (63.6%, a difference of 0.050%), Immigrants from Bahamas (63.6%, a difference of 0.060%), Immigrants from Brazil (63.6%, a difference of 0.060%), and Immigrants from Hungary (63.6%, a difference of 0.070%).
| Demographics | Rating | Rank | Family Households |
| Immigrants | South Africa | 5.9 /100 | #221 | Tragic 63.7% |
| Immigrants | Belarus | 5.5 /100 | #222 | Tragic 63.7% |
| French Canadians | 5.4 /100 | #223 | Tragic 63.7% |
| Turks | 4.5 /100 | #224 | Tragic 63.6% |
| Immigrants | Hungary | 4.3 /100 | #225 | Tragic 63.6% |
| Immigrants | Bahamas | 4.2 /100 | #226 | Tragic 63.6% |
| Trinidadians and Tobagonians | 4.1 /100 | #227 | Tragic 63.6% |
| Blackfeet | 3.6 /100 | #228 | Tragic 63.6% |
| Bulgarians | 3.4 /100 | #229 | Tragic 63.6% |
| Immigrants | Brazil | 3.0 /100 | #230 | Tragic 63.6% |
| Immigrants | Greece | 2.9 /100 | #231 | Tragic 63.5% |
| Immigrants | Northern Africa | 2.6 /100 | #232 | Tragic 63.5% |
| Immigrants | Armenia | 2.6 /100 | #233 | Tragic 63.5% |
| Finns | 2.3 /100 | #234 | Tragic 63.5% |
| Albanians | 2.2 /100 | #235 | Tragic 63.5% |
Demographics Similar to Immigrants from Germany by Family Households
In terms of family households, the demographic groups most similar to Immigrants from Germany are Immigrants from Sierra Leone (64.3%, a difference of 0.030%), Dutch West Indian (64.3%, a difference of 0.050%), Ute (64.3%, a difference of 0.060%), Iraqi (64.4%, a difference of 0.080%), and Armenian (64.4%, a difference of 0.080%).
| Demographics | Rating | Rank | Family Households |
| Irish | 57.9 /100 | #167 | Average 64.4% |
| Hondurans | 57.5 /100 | #168 | Average 64.4% |
| Iraqis | 56.0 /100 | #169 | Average 64.4% |
| Armenians | 55.9 /100 | #170 | Average 64.4% |
| Ute | 54.6 /100 | #171 | Average 64.3% |
| Dutch West Indians | 53.9 /100 | #172 | Average 64.3% |
| Immigrants | Sierra Leone | 52.5 /100 | #173 | Average 64.3% |
| Immigrants | Germany | 50.0 /100 | #174 | Average 64.3% |
| Bangladeshis | 44.3 /100 | #175 | Average 64.3% |
| Vietnamese | 43.6 /100 | #176 | Average 64.2% |
| Immigrants | Micronesia | 42.3 /100 | #177 | Average 64.2% |
| Jamaicans | 40.6 /100 | #178 | Average 64.2% |
| Immigrants | Ukraine | 38.2 /100 | #179 | Fair 64.2% |
| Immigrants | Honduras | 35.0 /100 | #180 | Fair 64.2% |
| Immigrants | Trinidad and Tobago | 34.9 /100 | #181 | Fair 64.2% |