Blackfeet vs Immigrants from Venezuela Family Households
COMPARE
Blackfeet
Immigrants from Venezuela
Family Households
Family Households Comparison
Blackfeet
Immigrants from Venezuela
63.6%
FAMILY HOUSEHOLDS
3.6/ 100
METRIC RATING
228th/ 347
METRIC RANK
66.4%
FAMILY HOUSEHOLDS
100.0/ 100
METRIC RATING
48th/ 347
METRIC RANK
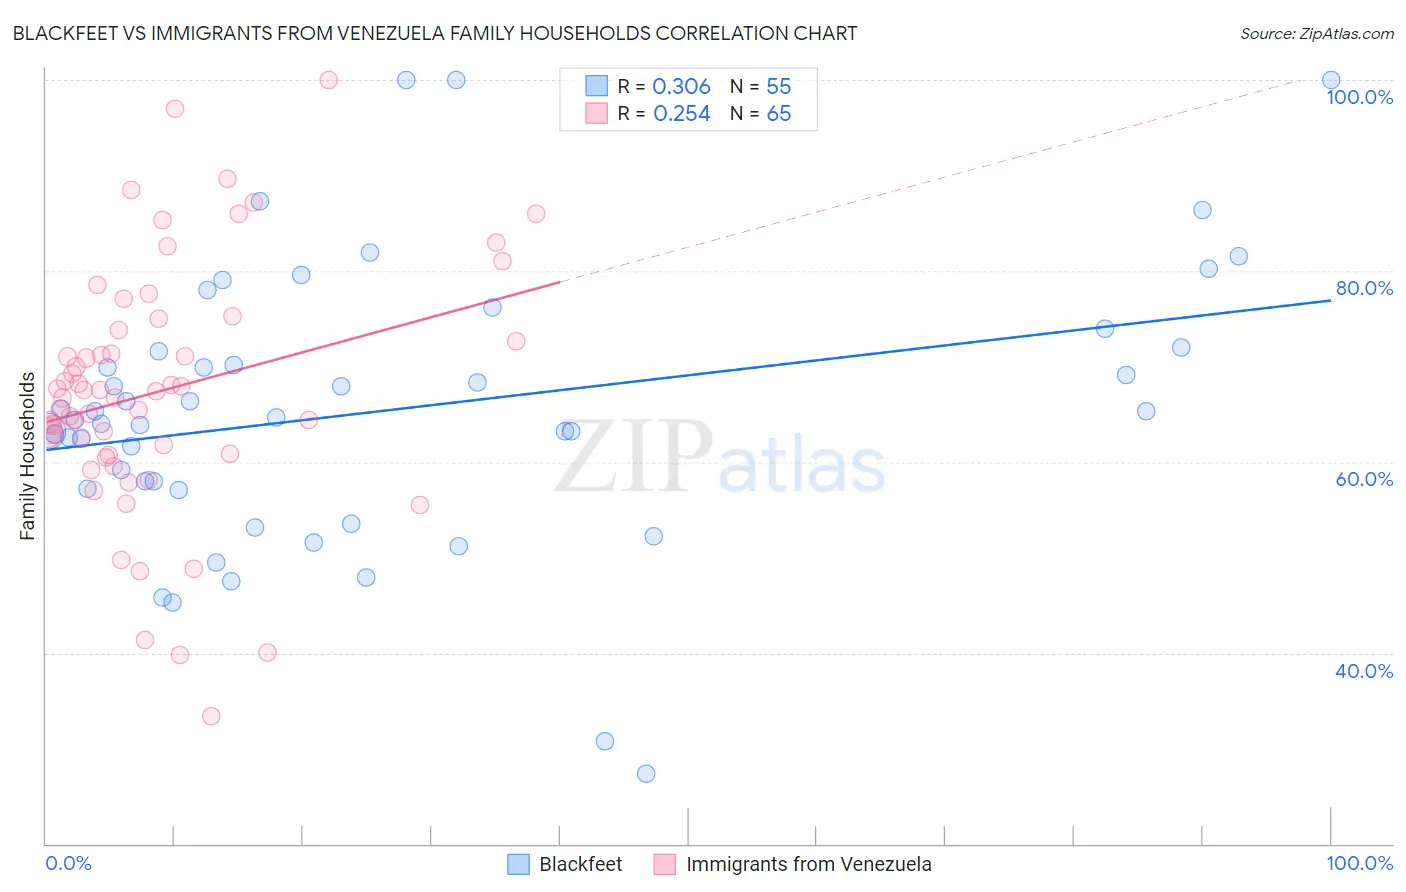
Blackfeet vs Immigrants from Venezuela Family Households Correlation Chart
The statistical analysis conducted on geographies consisting of 309,476,715 people shows a mild positive correlation between the proportion of Blackfeet and percentage of family households in the United States with a correlation coefficient (R) of 0.306 and weighted average of 63.6%. Similarly, the statistical analysis conducted on geographies consisting of 287,786,549 people shows a weak positive correlation between the proportion of Immigrants from Venezuela and percentage of family households in the United States with a correlation coefficient (R) of 0.254 and weighted average of 66.4%, a difference of 4.5%.
Family Households Correlation Summary
| Measurement | Blackfeet | Immigrants from Venezuela |
| Minimum | 27.3% | 33.3% |
| Maximum | 100.0% | 100.0% |
| Range | 72.7% | 66.7% |
| Mean | 65.5% | 67.5% |
| Median | 64.6% | 67.4% |
| Interquartile 25% (IQ1) | 57.2% | 60.7% |
| Interquartile 75% (IQ3) | 72.0% | 74.4% |
| Interquartile Range (IQR) | 14.9% | 13.6% |
| Standard Deviation (Sample) | 14.7% | 13.1% |
| Standard Deviation (Population) | 14.6% | 13.0% |
Similar Demographics by Family Households
Demographics Similar to Blackfeet by Family Households
In terms of family households, the demographic groups most similar to Blackfeet are Bulgarian (63.6%, a difference of 0.020%), Trinidadian and Tobagonian (63.6%, a difference of 0.050%), Immigrants from Bahamas (63.6%, a difference of 0.060%), Immigrants from Brazil (63.6%, a difference of 0.060%), and Immigrants from Hungary (63.6%, a difference of 0.070%).
| Demographics | Rating | Rank | Family Households |
| Immigrants | South Africa | 5.9 /100 | #221 | Tragic 63.7% |
| Immigrants | Belarus | 5.5 /100 | #222 | Tragic 63.7% |
| French Canadians | 5.4 /100 | #223 | Tragic 63.7% |
| Turks | 4.5 /100 | #224 | Tragic 63.6% |
| Immigrants | Hungary | 4.3 /100 | #225 | Tragic 63.6% |
| Immigrants | Bahamas | 4.2 /100 | #226 | Tragic 63.6% |
| Trinidadians and Tobagonians | 4.1 /100 | #227 | Tragic 63.6% |
| Blackfeet | 3.6 /100 | #228 | Tragic 63.6% |
| Bulgarians | 3.4 /100 | #229 | Tragic 63.6% |
| Immigrants | Brazil | 3.0 /100 | #230 | Tragic 63.6% |
| Immigrants | Greece | 2.9 /100 | #231 | Tragic 63.5% |
| Immigrants | Northern Africa | 2.6 /100 | #232 | Tragic 63.5% |
| Immigrants | Armenia | 2.6 /100 | #233 | Tragic 63.5% |
| Finns | 2.3 /100 | #234 | Tragic 63.5% |
| Albanians | 2.2 /100 | #235 | Tragic 63.5% |
Demographics Similar to Immigrants from Venezuela by Family Households
In terms of family households, the demographic groups most similar to Immigrants from Venezuela are Bolivian (66.5%, a difference of 0.020%), Arapaho (66.5%, a difference of 0.050%), Immigrants from South Central Asia (66.4%, a difference of 0.050%), Venezuelan (66.5%, a difference of 0.070%), and Asian (66.5%, a difference of 0.090%).
| Demographics | Rating | Rank | Family Households |
| Immigrants | Bolivia | 100.0 /100 | #41 | Exceptional 66.6% |
| Menominee | 100.0 /100 | #42 | Exceptional 66.5% |
| Apache | 100.0 /100 | #43 | Exceptional 66.5% |
| Asians | 100.0 /100 | #44 | Exceptional 66.5% |
| Venezuelans | 100.0 /100 | #45 | Exceptional 66.5% |
| Arapaho | 100.0 /100 | #46 | Exceptional 66.5% |
| Bolivians | 100.0 /100 | #47 | Exceptional 66.5% |
| Immigrants | Venezuela | 100.0 /100 | #48 | Exceptional 66.4% |
| Immigrants | South Central Asia | 100.0 /100 | #49 | Exceptional 66.4% |
| Navajo | 100.0 /100 | #50 | Exceptional 66.4% |
| Natives/Alaskans | 100.0 /100 | #51 | Exceptional 66.4% |
| Colombians | 100.0 /100 | #52 | Exceptional 66.3% |
| Afghans | 100.0 /100 | #53 | Exceptional 66.3% |
| Immigrants | Colombia | 100.0 /100 | #54 | Exceptional 66.3% |
| Immigrants | Immigrants | 100.0 /100 | #55 | Exceptional 66.1% |