Argentinean vs Immigrants from Czechoslovakia Currently Married
COMPARE
Argentinean
Immigrants from Czechoslovakia
Currently Married
Currently Married Comparison
Argentineans
Immigrants from Czechoslovakia
47.1%
CURRENTLY MARRIED
74.4/ 100
METRIC RATING
142nd/ 347
METRIC RANK
48.4%
CURRENTLY MARRIED
98.3/ 100
METRIC RATING
64th/ 347
METRIC RANK
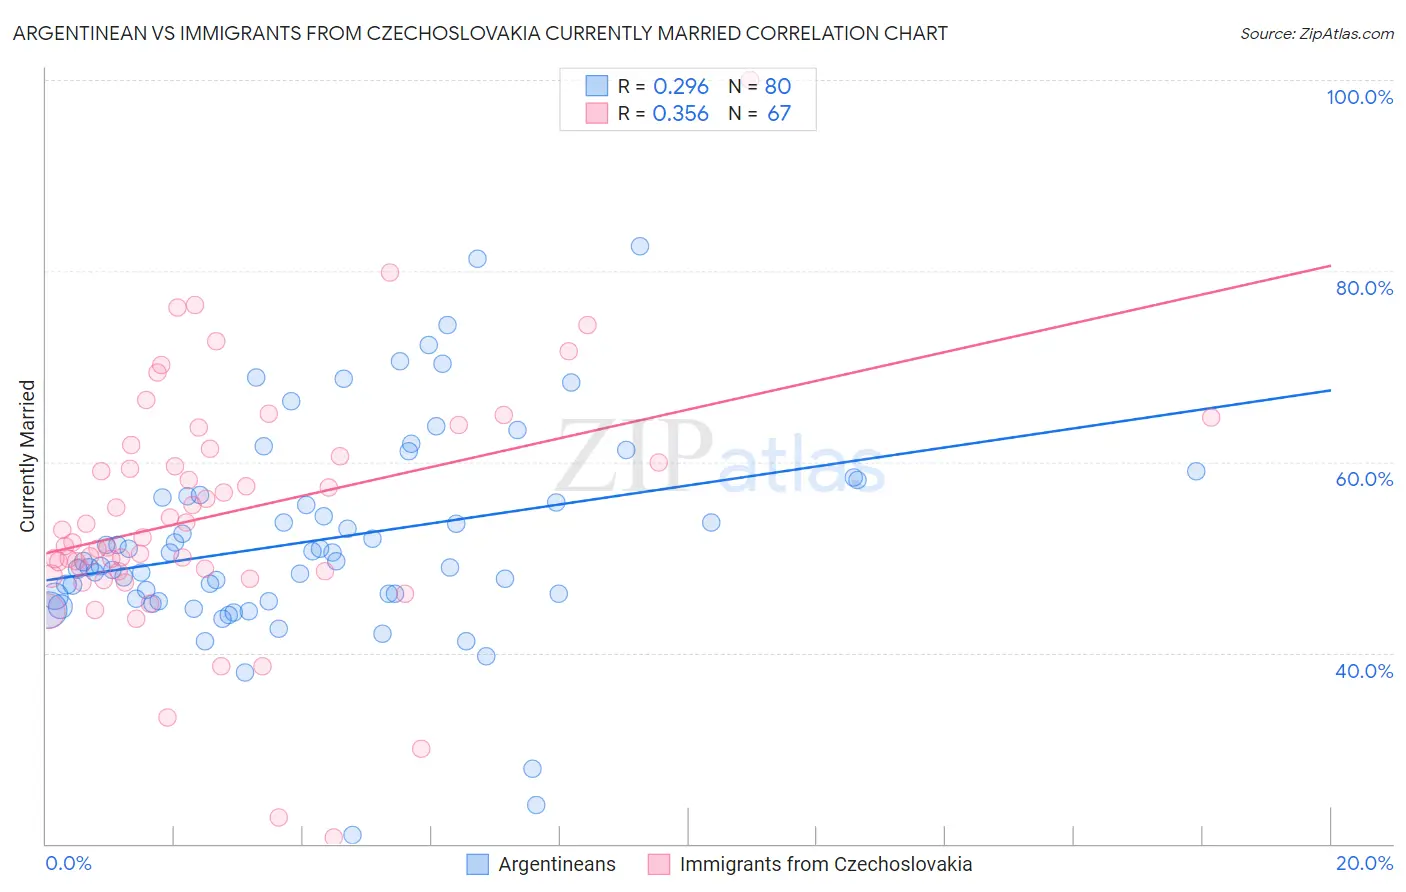
Argentinean vs Immigrants from Czechoslovakia Currently Married Correlation Chart
The statistical analysis conducted on geographies consisting of 297,105,288 people shows a weak positive correlation between the proportion of Argentineans and percentage of population currently married in the United States with a correlation coefficient (R) of 0.296 and weighted average of 47.1%. Similarly, the statistical analysis conducted on geographies consisting of 195,455,997 people shows a mild positive correlation between the proportion of Immigrants from Czechoslovakia and percentage of population currently married in the United States with a correlation coefficient (R) of 0.356 and weighted average of 48.4%, a difference of 2.7%.
Currently Married Correlation Summary
| Measurement | Argentinean | Immigrants from Czechoslovakia |
| Minimum | 20.9% | 20.6% |
| Maximum | 82.6% | 100.0% |
| Range | 61.7% | 79.4% |
| Mean | 51.8% | 54.6% |
| Median | 49.6% | 52.0% |
| Interquartile 25% (IQ1) | 45.8% | 48.5% |
| Interquartile 75% (IQ3) | 56.5% | 61.4% |
| Interquartile Range (IQR) | 10.7% | 12.9% |
| Standard Deviation (Sample) | 10.9% | 12.8% |
| Standard Deviation (Population) | 10.8% | 12.7% |
Similar Demographics by Currently Married
Demographics Similar to Argentineans by Currently Married
In terms of currently married, the demographic groups most similar to Argentineans are Venezuelan (47.1%, a difference of 0.0%), Guamanian/Chamorro (47.1%, a difference of 0.010%), Cajun (47.1%, a difference of 0.040%), Hmong (47.1%, a difference of 0.040%), and Immigrants from South Eastern Asia (47.1%, a difference of 0.070%).
| Demographics | Rating | Rank | Currently Married |
| Immigrants | Norway | 79.7 /100 | #135 | Good 47.2% |
| Immigrants | Vietnam | 78.2 /100 | #136 | Good 47.2% |
| Paraguayans | 77.8 /100 | #137 | Good 47.2% |
| Pakistanis | 77.5 /100 | #138 | Good 47.2% |
| Yugoslavians | 77.4 /100 | #139 | Good 47.2% |
| Cajuns | 75.3 /100 | #140 | Good 47.1% |
| Venezuelans | 74.4 /100 | #141 | Good 47.1% |
| Argentineans | 74.4 /100 | #142 | Good 47.1% |
| Guamanians/Chamorros | 74.2 /100 | #143 | Good 47.1% |
| Hmong | 73.4 /100 | #144 | Good 47.1% |
| Immigrants | South Eastern Asia | 72.9 /100 | #145 | Good 47.1% |
| Carpatho Rusyns | 72.6 /100 | #146 | Good 47.0% |
| Immigrants | Argentina | 72.0 /100 | #147 | Good 47.0% |
| Cambodians | 70.4 /100 | #148 | Good 47.0% |
| Zimbabweans | 70.1 /100 | #149 | Good 47.0% |
Demographics Similar to Immigrants from Czechoslovakia by Currently Married
In terms of currently married, the demographic groups most similar to Immigrants from Czechoslovakia are Slavic (48.4%, a difference of 0.0%), Ukrainian (48.4%, a difference of 0.010%), Tongan (48.3%, a difference of 0.030%), Slovak (48.3%, a difference of 0.050%), and Immigrants from England (48.3%, a difference of 0.060%).
| Demographics | Rating | Rank | Currently Married |
| Immigrants | Netherlands | 98.6 /100 | #57 | Exceptional 48.5% |
| French | 98.6 /100 | #58 | Exceptional 48.4% |
| Immigrants | Ireland | 98.5 /100 | #59 | Exceptional 48.4% |
| Immigrants | Romania | 98.5 /100 | #60 | Exceptional 48.4% |
| Romanians | 98.5 /100 | #61 | Exceptional 48.4% |
| Asians | 98.5 /100 | #62 | Exceptional 48.4% |
| Slavs | 98.3 /100 | #63 | Exceptional 48.4% |
| Immigrants | Czechoslovakia | 98.3 /100 | #64 | Exceptional 48.4% |
| Ukrainians | 98.3 /100 | #65 | Exceptional 48.4% |
| Tongans | 98.2 /100 | #66 | Exceptional 48.3% |
| Slovaks | 98.2 /100 | #67 | Exceptional 48.3% |
| Immigrants | England | 98.2 /100 | #68 | Exceptional 48.3% |
| Canadians | 98.1 /100 | #69 | Exceptional 48.3% |
| Immigrants | Asia | 97.9 /100 | #70 | Exceptional 48.3% |
| Macedonians | 97.9 /100 | #71 | Exceptional 48.3% |