Barbadian vs Panamanian Currently Married
COMPARE
Barbadian
Panamanian
Currently Married
Currently Married Comparison
Barbadians
Panamanians
40.6%
CURRENTLY MARRIED
0.0/ 100
METRIC RATING
326th/ 347
METRIC RANK
45.3%
CURRENTLY MARRIED
4.0/ 100
METRIC RATING
218th/ 347
METRIC RANK
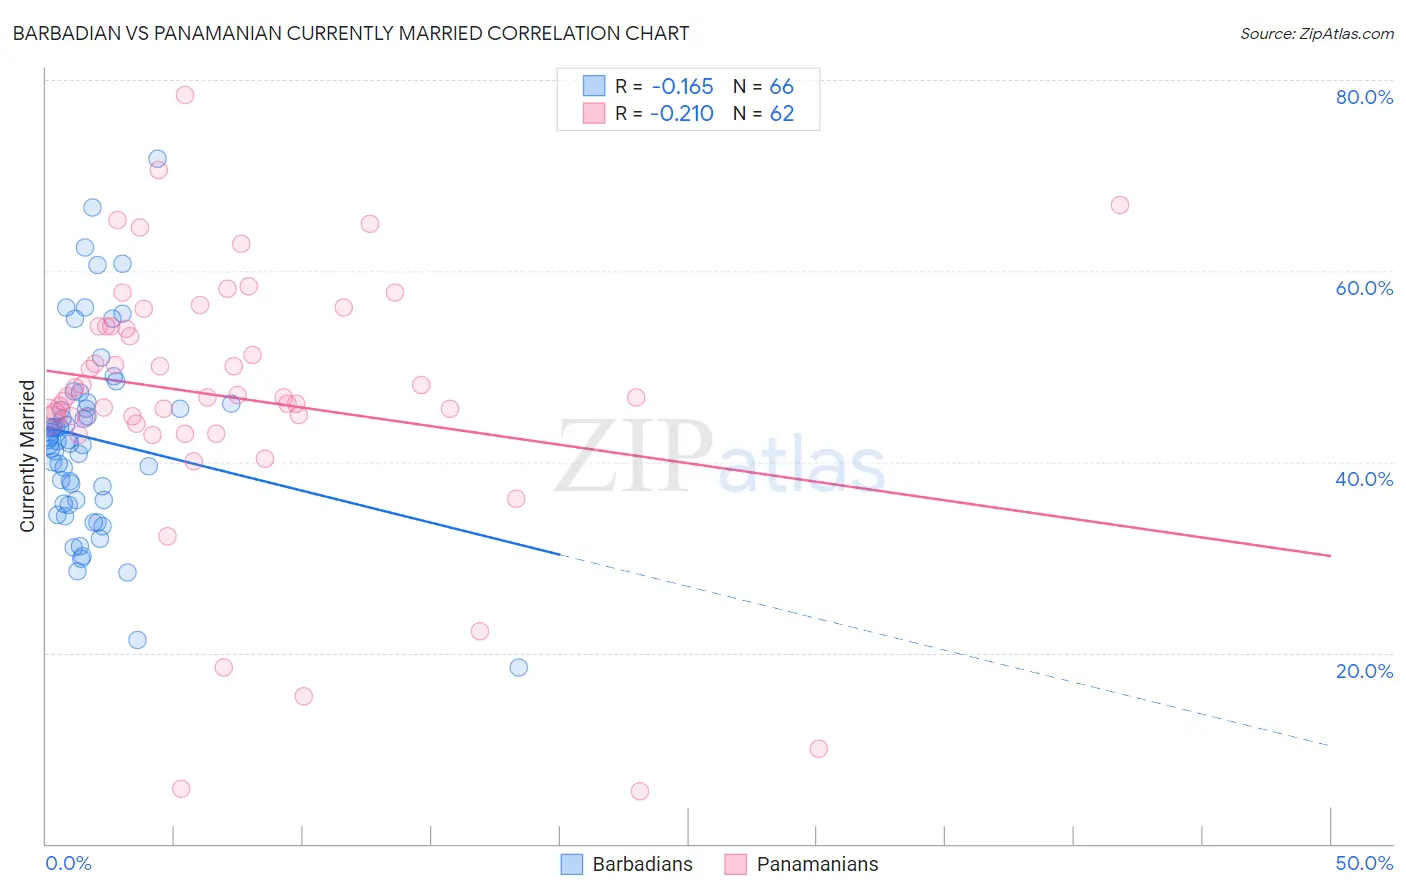
Barbadian vs Panamanian Currently Married Correlation Chart
The statistical analysis conducted on geographies consisting of 141,300,179 people shows a poor negative correlation between the proportion of Barbadians and percentage of population currently married in the United States with a correlation coefficient (R) of -0.165 and weighted average of 40.6%. Similarly, the statistical analysis conducted on geographies consisting of 281,208,339 people shows a weak negative correlation between the proportion of Panamanians and percentage of population currently married in the United States with a correlation coefficient (R) of -0.210 and weighted average of 45.3%, a difference of 11.4%.
Currently Married Correlation Summary
| Measurement | Barbadian | Panamanian |
| Minimum | 18.4% | 5.5% |
| Maximum | 71.7% | 78.4% |
| Range | 53.3% | 72.9% |
| Mean | 42.5% | 46.8% |
| Median | 42.2% | 46.8% |
| Interquartile 25% (IQ1) | 36.0% | 44.6% |
| Interquartile 75% (IQ3) | 46.1% | 54.2% |
| Interquartile Range (IQR) | 10.1% | 9.5% |
| Standard Deviation (Sample) | 9.9% | 14.0% |
| Standard Deviation (Population) | 9.9% | 13.9% |
Similar Demographics by Currently Married
Demographics Similar to Barbadians by Currently Married
In terms of currently married, the demographic groups most similar to Barbadians are U.S. Virgin Islander (40.7%, a difference of 0.14%), Senegalese (40.6%, a difference of 0.17%), Immigrants from Senegal (40.7%, a difference of 0.19%), Immigrants from West Indies (40.7%, a difference of 0.20%), and Arapaho (40.5%, a difference of 0.22%).
| Demographics | Rating | Rank | Currently Married |
| Immigrants | Somalia | 0.0 /100 | #319 | Tragic 41.2% |
| Immigrants | Jamaica | 0.0 /100 | #320 | Tragic 41.1% |
| Immigrants | Congo | 0.0 /100 | #321 | Tragic 41.1% |
| Immigrants | Haiti | 0.0 /100 | #322 | Tragic 41.0% |
| Immigrants | West Indies | 0.0 /100 | #323 | Tragic 40.7% |
| Immigrants | Senegal | 0.0 /100 | #324 | Tragic 40.7% |
| U.S. Virgin Islanders | 0.0 /100 | #325 | Tragic 40.7% |
| Barbadians | 0.0 /100 | #326 | Tragic 40.6% |
| Senegalese | 0.0 /100 | #327 | Tragic 40.6% |
| Arapaho | 0.0 /100 | #328 | Tragic 40.5% |
| Crow | 0.0 /100 | #329 | Tragic 40.4% |
| Immigrants | Dominica | 0.0 /100 | #330 | Tragic 40.3% |
| Immigrants | Barbados | 0.0 /100 | #331 | Tragic 40.3% |
| Immigrants | St. Vincent and the Grenadines | 0.0 /100 | #332 | Tragic 40.1% |
| Yup'ik | 0.0 /100 | #333 | Tragic 39.9% |
Demographics Similar to Panamanians by Currently Married
In terms of currently married, the demographic groups most similar to Panamanians are Immigrants from Portugal (45.2%, a difference of 0.12%), Immigrants from Thailand (45.4%, a difference of 0.24%), Kenyan (45.2%, a difference of 0.24%), Mexican (45.2%, a difference of 0.26%), and Immigrants from Morocco (45.4%, a difference of 0.33%).
| Demographics | Rating | Rank | Currently Married |
| Houma | 7.2 /100 | #211 | Tragic 45.5% |
| Marshallese | 7.2 /100 | #212 | Tragic 45.5% |
| Alaska Natives | 7.0 /100 | #213 | Tragic 45.5% |
| Dutch West Indians | 6.7 /100 | #214 | Tragic 45.5% |
| German Russians | 6.7 /100 | #215 | Tragic 45.5% |
| Immigrants | Morocco | 5.5 /100 | #216 | Tragic 45.4% |
| Immigrants | Thailand | 5.1 /100 | #217 | Tragic 45.4% |
| Panamanians | 4.0 /100 | #218 | Tragic 45.3% |
| Immigrants | Portugal | 3.5 /100 | #219 | Tragic 45.2% |
| Kenyans | 3.1 /100 | #220 | Tragic 45.2% |
| Mexicans | 3.0 /100 | #221 | Tragic 45.2% |
| Immigrants | Azores | 2.5 /100 | #222 | Tragic 45.1% |
| Immigrants | Laos | 2.3 /100 | #223 | Tragic 45.0% |
| Immigrants | Uganda | 2.2 /100 | #224 | Tragic 45.0% |
| French American Indians | 2.2 /100 | #225 | Tragic 45.0% |