Barbadian vs Slavic Currently Married
COMPARE
Barbadian
Slavic
Currently Married
Currently Married Comparison
Barbadians
Slavs
40.6%
CURRENTLY MARRIED
0.0/ 100
METRIC RATING
326th/ 347
METRIC RANK
48.4%
CURRENTLY MARRIED
98.3/ 100
METRIC RATING
63rd/ 347
METRIC RANK
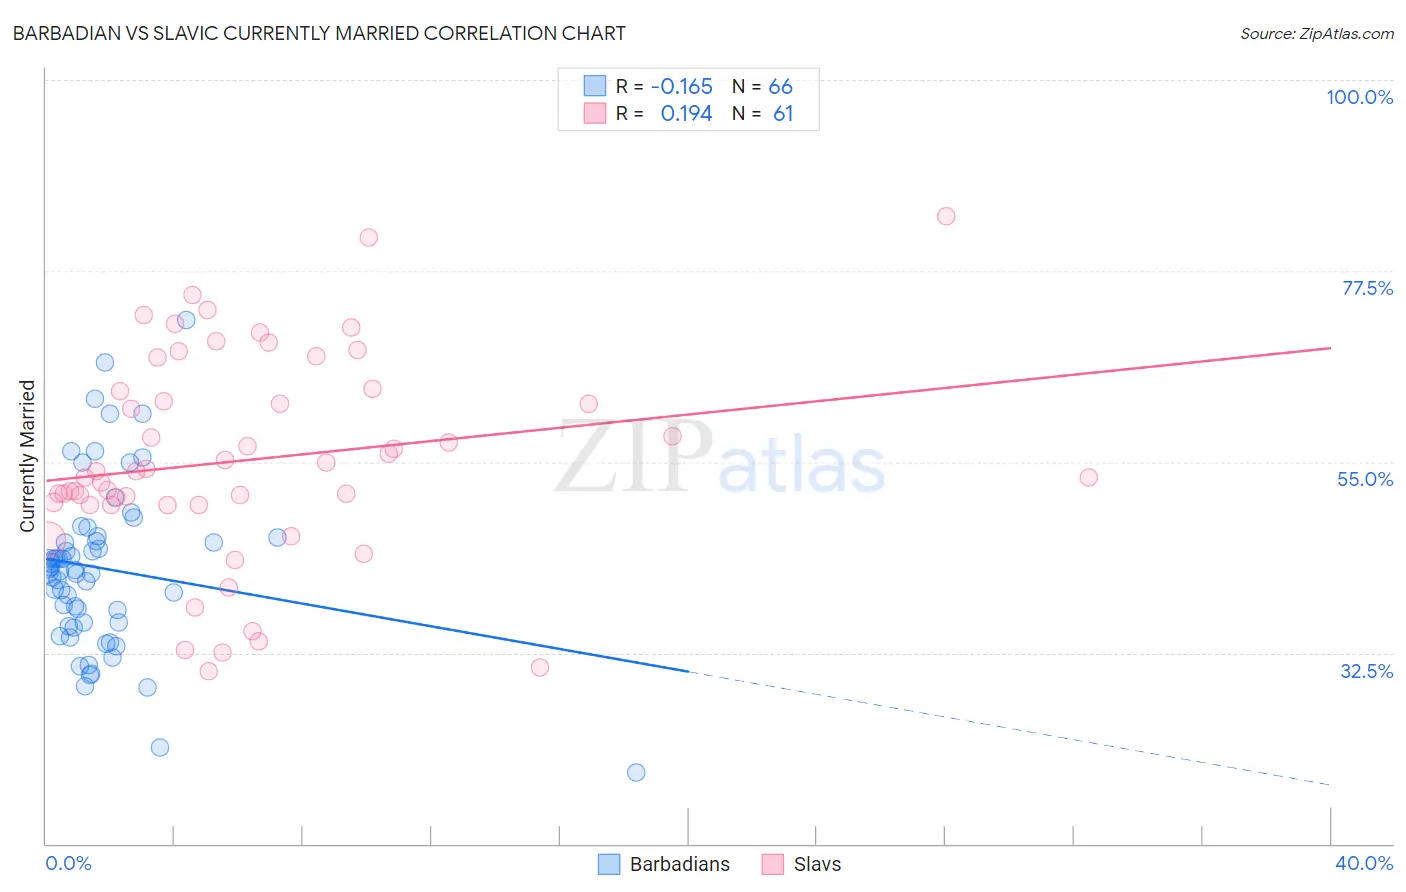
Barbadian vs Slavic Currently Married Correlation Chart
The statistical analysis conducted on geographies consisting of 141,300,179 people shows a poor negative correlation between the proportion of Barbadians and percentage of population currently married in the United States with a correlation coefficient (R) of -0.165 and weighted average of 40.6%. Similarly, the statistical analysis conducted on geographies consisting of 270,868,948 people shows a poor positive correlation between the proportion of Slavs and percentage of population currently married in the United States with a correlation coefficient (R) of 0.194 and weighted average of 48.4%, a difference of 19.0%.
Currently Married Correlation Summary
| Measurement | Barbadian | Slavic |
| Minimum | 18.4% | 30.3% |
| Maximum | 71.7% | 84.0% |
| Range | 53.3% | 53.7% |
| Mean | 42.5% | 55.2% |
| Median | 42.2% | 53.9% |
| Interquartile 25% (IQ1) | 36.0% | 50.0% |
| Interquartile 75% (IQ3) | 46.1% | 63.5% |
| Interquartile Range (IQR) | 10.1% | 13.6% |
| Standard Deviation (Sample) | 9.9% | 12.2% |
| Standard Deviation (Population) | 9.9% | 12.1% |
Similar Demographics by Currently Married
Demographics Similar to Barbadians by Currently Married
In terms of currently married, the demographic groups most similar to Barbadians are U.S. Virgin Islander (40.7%, a difference of 0.14%), Senegalese (40.6%, a difference of 0.17%), Immigrants from Senegal (40.7%, a difference of 0.19%), Immigrants from West Indies (40.7%, a difference of 0.20%), and Arapaho (40.5%, a difference of 0.22%).
| Demographics | Rating | Rank | Currently Married |
| Immigrants | Somalia | 0.0 /100 | #319 | Tragic 41.2% |
| Immigrants | Jamaica | 0.0 /100 | #320 | Tragic 41.1% |
| Immigrants | Congo | 0.0 /100 | #321 | Tragic 41.1% |
| Immigrants | Haiti | 0.0 /100 | #322 | Tragic 41.0% |
| Immigrants | West Indies | 0.0 /100 | #323 | Tragic 40.7% |
| Immigrants | Senegal | 0.0 /100 | #324 | Tragic 40.7% |
| U.S. Virgin Islanders | 0.0 /100 | #325 | Tragic 40.7% |
| Barbadians | 0.0 /100 | #326 | Tragic 40.6% |
| Senegalese | 0.0 /100 | #327 | Tragic 40.6% |
| Arapaho | 0.0 /100 | #328 | Tragic 40.5% |
| Crow | 0.0 /100 | #329 | Tragic 40.4% |
| Immigrants | Dominica | 0.0 /100 | #330 | Tragic 40.3% |
| Immigrants | Barbados | 0.0 /100 | #331 | Tragic 40.3% |
| Immigrants | St. Vincent and the Grenadines | 0.0 /100 | #332 | Tragic 40.1% |
| Yup'ik | 0.0 /100 | #333 | Tragic 39.9% |
Demographics Similar to Slavs by Currently Married
In terms of currently married, the demographic groups most similar to Slavs are Immigrants from Czechoslovakia (48.4%, a difference of 0.0%), Ukrainian (48.4%, a difference of 0.010%), Tongan (48.3%, a difference of 0.040%), Slovak (48.3%, a difference of 0.050%), and Immigrants from England (48.3%, a difference of 0.060%).
| Demographics | Rating | Rank | Currently Married |
| Latvians | 98.7 /100 | #56 | Exceptional 48.5% |
| Immigrants | Netherlands | 98.6 /100 | #57 | Exceptional 48.5% |
| French | 98.6 /100 | #58 | Exceptional 48.4% |
| Immigrants | Ireland | 98.5 /100 | #59 | Exceptional 48.4% |
| Immigrants | Romania | 98.5 /100 | #60 | Exceptional 48.4% |
| Romanians | 98.5 /100 | #61 | Exceptional 48.4% |
| Asians | 98.5 /100 | #62 | Exceptional 48.4% |
| Slavs | 98.3 /100 | #63 | Exceptional 48.4% |
| Immigrants | Czechoslovakia | 98.3 /100 | #64 | Exceptional 48.4% |
| Ukrainians | 98.3 /100 | #65 | Exceptional 48.4% |
| Tongans | 98.2 /100 | #66 | Exceptional 48.3% |
| Slovaks | 98.2 /100 | #67 | Exceptional 48.3% |
| Immigrants | England | 98.2 /100 | #68 | Exceptional 48.3% |
| Canadians | 98.1 /100 | #69 | Exceptional 48.3% |
| Immigrants | Asia | 97.9 /100 | #70 | Exceptional 48.3% |