Bangladeshi vs Immigrants from Jordan Female Poverty Among 18-24 Year Olds
COMPARE
Bangladeshi
Immigrants from Jordan
Female Poverty Among 18-24 Year Olds
Female Poverty Among 18-24 Year Olds Comparison
Bangladeshis
Immigrants from Jordan
22.5%
FEMALE POVERTY AMONG 18-24 YEAR OLDS
0.0/ 100
METRIC RATING
291st/ 347
METRIC RANK
19.1%
FEMALE POVERTY AMONG 18-24 YEAR OLDS
98.4/ 100
METRIC RATING
98th/ 347
METRIC RANK
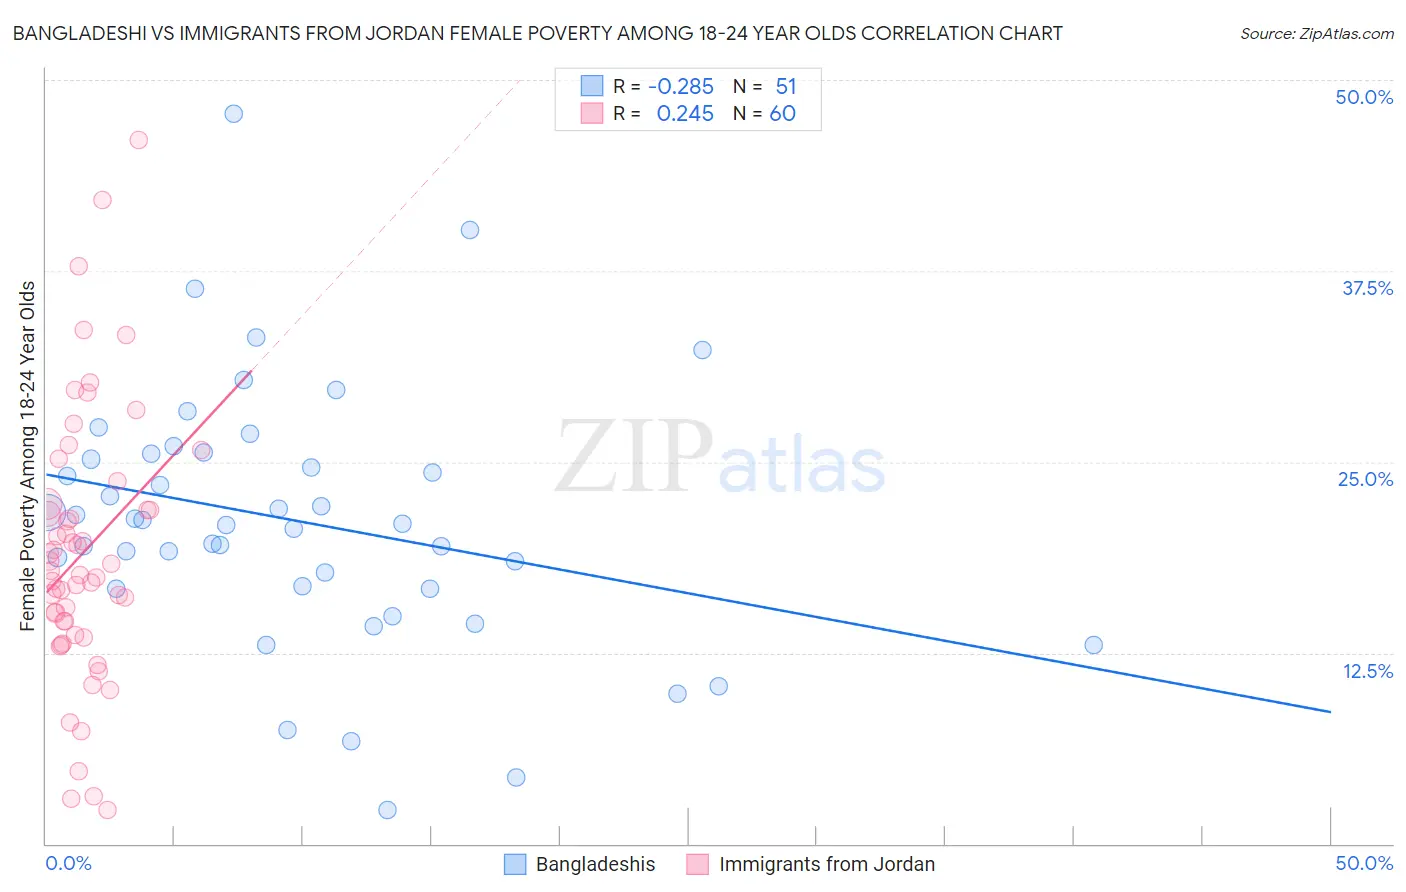
Bangladeshi vs Immigrants from Jordan Female Poverty Among 18-24 Year Olds Correlation Chart
The statistical analysis conducted on geographies consisting of 140,222,354 people shows a weak negative correlation between the proportion of Bangladeshis and poverty level among females between the ages 18 and 24 in the United States with a correlation coefficient (R) of -0.285 and weighted average of 22.5%. Similarly, the statistical analysis conducted on geographies consisting of 179,737,092 people shows a weak positive correlation between the proportion of Immigrants from Jordan and poverty level among females between the ages 18 and 24 in the United States with a correlation coefficient (R) of 0.245 and weighted average of 19.1%, a difference of 17.6%.
Female Poverty Among 18-24 Year Olds Correlation Summary
| Measurement | Bangladeshi | Immigrants from Jordan |
| Minimum | 2.2% | 2.2% |
| Maximum | 47.8% | 46.0% |
| Range | 45.6% | 43.9% |
| Mean | 21.1% | 19.0% |
| Median | 20.9% | 17.7% |
| Interquartile 25% (IQ1) | 16.7% | 14.1% |
| Interquartile 75% (IQ3) | 25.5% | 22.1% |
| Interquartile Range (IQR) | 8.8% | 7.9% |
| Standard Deviation (Sample) | 8.5% | 8.8% |
| Standard Deviation (Population) | 8.4% | 8.7% |
Similar Demographics by Female Poverty Among 18-24 Year Olds
Demographics Similar to Bangladeshis by Female Poverty Among 18-24 Year Olds
In terms of female poverty among 18-24 year olds, the demographic groups most similar to Bangladeshis are Alaskan Athabascan (22.5%, a difference of 0.050%), U.S. Virgin Islander (22.5%, a difference of 0.080%), Indonesian (22.5%, a difference of 0.12%), Shoshone (22.5%, a difference of 0.24%), and Immigrants from Senegal (22.4%, a difference of 0.27%).
| Demographics | Rating | Rank | Female Poverty Among 18-24 Year Olds |
| Tlingit-Haida | 0.0 /100 | #284 | Tragic 22.0% |
| Ottawa | 0.0 /100 | #285 | Tragic 22.0% |
| Ugandans | 0.0 /100 | #286 | Tragic 22.1% |
| Immigrants | Middle Africa | 0.0 /100 | #287 | Tragic 22.1% |
| Dominicans | 0.0 /100 | #288 | Tragic 22.3% |
| French American Indians | 0.0 /100 | #289 | Tragic 22.3% |
| Immigrants | Senegal | 0.0 /100 | #290 | Tragic 22.4% |
| Bangladeshis | 0.0 /100 | #291 | Tragic 22.5% |
| Alaskan Athabascans | 0.0 /100 | #292 | Tragic 22.5% |
| U.S. Virgin Islanders | 0.0 /100 | #293 | Tragic 22.5% |
| Indonesians | 0.0 /100 | #294 | Tragic 22.5% |
| Shoshone | 0.0 /100 | #295 | Tragic 22.5% |
| Menominee | 0.0 /100 | #296 | Tragic 22.5% |
| Inupiat | 0.0 /100 | #297 | Tragic 22.6% |
| Central American Indians | 0.0 /100 | #298 | Tragic 22.6% |
Demographics Similar to Immigrants from Jordan by Female Poverty Among 18-24 Year Olds
In terms of female poverty among 18-24 year olds, the demographic groups most similar to Immigrants from Jordan are Salvadoran (19.1%, a difference of 0.010%), Immigrants from Czechoslovakia (19.1%, a difference of 0.070%), Chilean (19.1%, a difference of 0.090%), Ecuadorian (19.1%, a difference of 0.18%), and Immigrants from Caribbean (19.1%, a difference of 0.20%).
| Demographics | Rating | Rank | Female Poverty Among 18-24 Year Olds |
| Romanians | 98.9 /100 | #91 | Exceptional 19.0% |
| Filipinos | 98.9 /100 | #92 | Exceptional 19.0% |
| Haitians | 98.9 /100 | #93 | Exceptional 19.0% |
| Ukrainians | 98.8 /100 | #94 | Exceptional 19.0% |
| Guamanians/Chamorros | 98.8 /100 | #95 | Exceptional 19.0% |
| Sierra Leoneans | 98.7 /100 | #96 | Exceptional 19.0% |
| Salvadorans | 98.4 /100 | #97 | Exceptional 19.1% |
| Immigrants | Jordan | 98.4 /100 | #98 | Exceptional 19.1% |
| Immigrants | Czechoslovakia | 98.3 /100 | #99 | Exceptional 19.1% |
| Chileans | 98.3 /100 | #100 | Exceptional 19.1% |
| Ecuadorians | 98.1 /100 | #101 | Exceptional 19.1% |
| Immigrants | Caribbean | 98.1 /100 | #102 | Exceptional 19.1% |
| Serbians | 98.0 /100 | #103 | Exceptional 19.1% |
| Immigrants | Afghanistan | 98.0 /100 | #104 | Exceptional 19.1% |
| Immigrants | Ecuador | 97.8 /100 | #105 | Exceptional 19.2% |