Bangladeshi vs Romanian Currently Married
COMPARE
Bangladeshi
Romanian
Currently Married
Currently Married Comparison
Bangladeshis
Romanians
43.7%
CURRENTLY MARRIED
0.1/ 100
METRIC RATING
262nd/ 347
METRIC RANK
48.4%
CURRENTLY MARRIED
98.5/ 100
METRIC RATING
61st/ 347
METRIC RANK
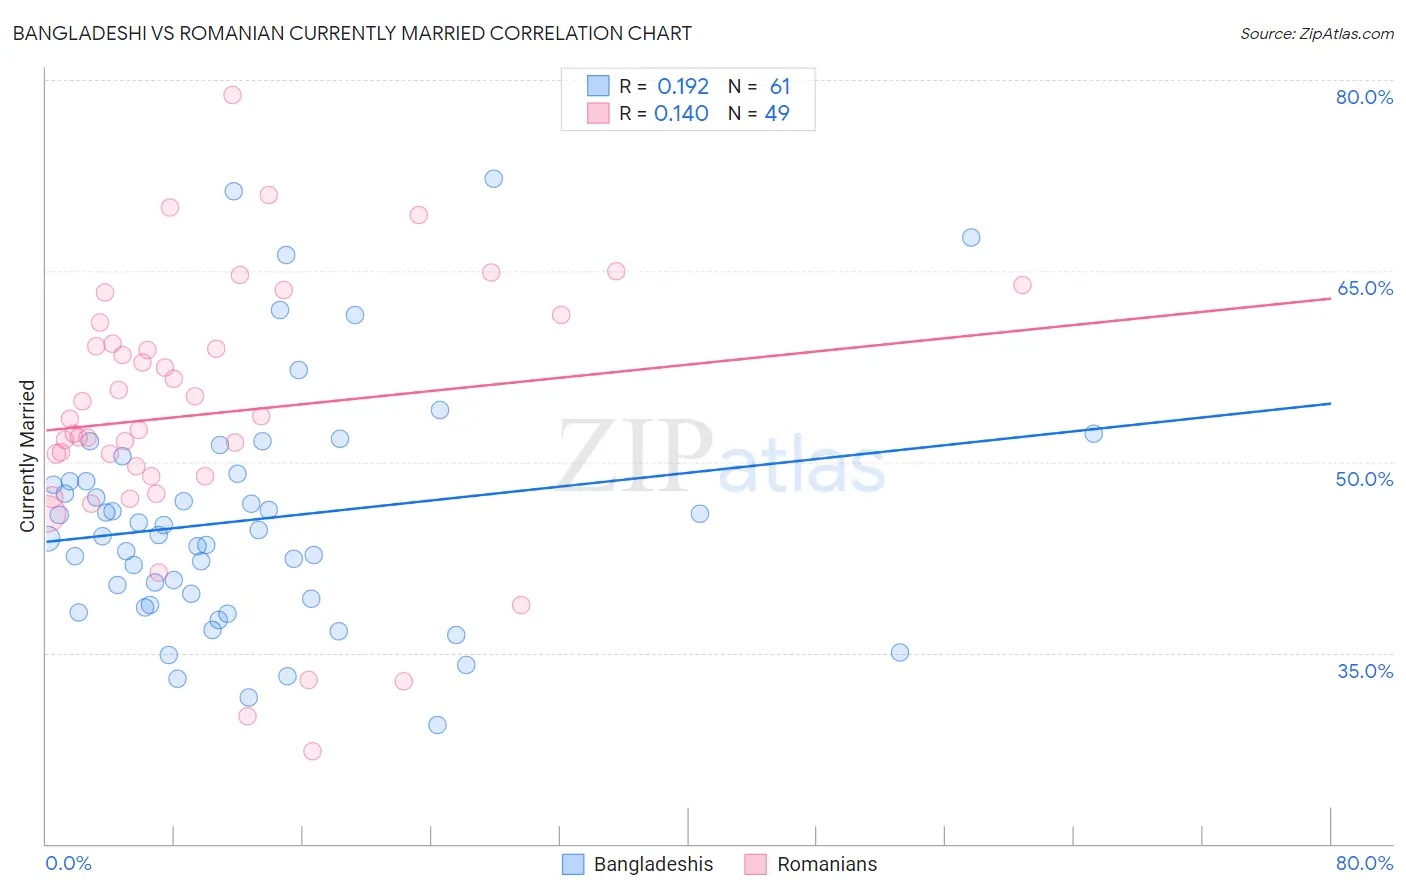
Bangladeshi vs Romanian Currently Married Correlation Chart
The statistical analysis conducted on geographies consisting of 141,443,352 people shows a poor positive correlation between the proportion of Bangladeshis and percentage of population currently married in the United States with a correlation coefficient (R) of 0.192 and weighted average of 43.7%. Similarly, the statistical analysis conducted on geographies consisting of 377,883,259 people shows a poor positive correlation between the proportion of Romanians and percentage of population currently married in the United States with a correlation coefficient (R) of 0.140 and weighted average of 48.4%, a difference of 10.8%.
Currently Married Correlation Summary
| Measurement | Bangladeshi | Romanian |
| Minimum | 29.3% | 27.3% |
| Maximum | 72.2% | 78.8% |
| Range | 42.9% | 51.5% |
| Mean | 45.5% | 53.8% |
| Median | 44.3% | 53.4% |
| Interquartile 25% (IQ1) | 39.0% | 48.9% |
| Interquartile 75% (IQ3) | 48.8% | 60.1% |
| Interquartile Range (IQR) | 9.8% | 11.2% |
| Standard Deviation (Sample) | 9.3% | 10.5% |
| Standard Deviation (Population) | 9.2% | 10.4% |
Similar Demographics by Currently Married
Demographics Similar to Bangladeshis by Currently Married
In terms of currently married, the demographic groups most similar to Bangladeshis are Immigrants from Cuba (43.7%, a difference of 0.040%), Sudanese (43.7%, a difference of 0.050%), Immigrants from Nicaragua (43.7%, a difference of 0.14%), Immigrants from Bangladesh (43.6%, a difference of 0.14%), and Immigrants from Latin America (43.8%, a difference of 0.18%).
| Demographics | Rating | Rank | Currently Married |
| Yakama | 0.2 /100 | #255 | Tragic 44.0% |
| Shoshone | 0.2 /100 | #256 | Tragic 44.0% |
| Immigrants | Africa | 0.2 /100 | #257 | Tragic 43.9% |
| Ute | 0.2 /100 | #258 | Tragic 43.9% |
| Immigrants | Sierra Leone | 0.1 /100 | #259 | Tragic 43.8% |
| Immigrants | Latin America | 0.1 /100 | #260 | Tragic 43.8% |
| Immigrants | Nicaragua | 0.1 /100 | #261 | Tragic 43.7% |
| Bangladeshis | 0.1 /100 | #262 | Tragic 43.7% |
| Immigrants | Cuba | 0.1 /100 | #263 | Tragic 43.7% |
| Sudanese | 0.1 /100 | #264 | Tragic 43.7% |
| Immigrants | Bangladesh | 0.1 /100 | #265 | Tragic 43.6% |
| Ecuadorians | 0.1 /100 | #266 | Tragic 43.6% |
| Immigrants | Eritrea | 0.1 /100 | #267 | Tragic 43.6% |
| Spanish American Indians | 0.1 /100 | #268 | Tragic 43.6% |
| Immigrants | Sudan | 0.1 /100 | #269 | Tragic 43.5% |
Demographics Similar to Romanians by Currently Married
In terms of currently married, the demographic groups most similar to Romanians are Asian (48.4%, a difference of 0.0%), Immigrants from Romania (48.4%, a difference of 0.010%), Immigrants from Ireland (48.4%, a difference of 0.030%), French (48.4%, a difference of 0.050%), and Immigrants from Netherlands (48.5%, a difference of 0.10%).
| Demographics | Rating | Rank | Currently Married |
| Immigrants | Moldova | 98.7 /100 | #54 | Exceptional 48.5% |
| Immigrants | North Macedonia | 98.7 /100 | #55 | Exceptional 48.5% |
| Latvians | 98.7 /100 | #56 | Exceptional 48.5% |
| Immigrants | Netherlands | 98.6 /100 | #57 | Exceptional 48.5% |
| French | 98.6 /100 | #58 | Exceptional 48.4% |
| Immigrants | Ireland | 98.5 /100 | #59 | Exceptional 48.4% |
| Immigrants | Romania | 98.5 /100 | #60 | Exceptional 48.4% |
| Romanians | 98.5 /100 | #61 | Exceptional 48.4% |
| Asians | 98.5 /100 | #62 | Exceptional 48.4% |
| Slavs | 98.3 /100 | #63 | Exceptional 48.4% |
| Immigrants | Czechoslovakia | 98.3 /100 | #64 | Exceptional 48.4% |
| Ukrainians | 98.3 /100 | #65 | Exceptional 48.4% |
| Tongans | 98.2 /100 | #66 | Exceptional 48.3% |
| Slovaks | 98.2 /100 | #67 | Exceptional 48.3% |
| Immigrants | England | 98.2 /100 | #68 | Exceptional 48.3% |