Bangladeshi vs Immigrants from Congo Currently Married
COMPARE
Bangladeshi
Immigrants from Congo
Currently Married
Currently Married Comparison
Bangladeshis
Immigrants from Congo
43.7%
CURRENTLY MARRIED
0.1/ 100
METRIC RATING
262nd/ 347
METRIC RANK
41.1%
CURRENTLY MARRIED
0.0/ 100
METRIC RATING
321st/ 347
METRIC RANK
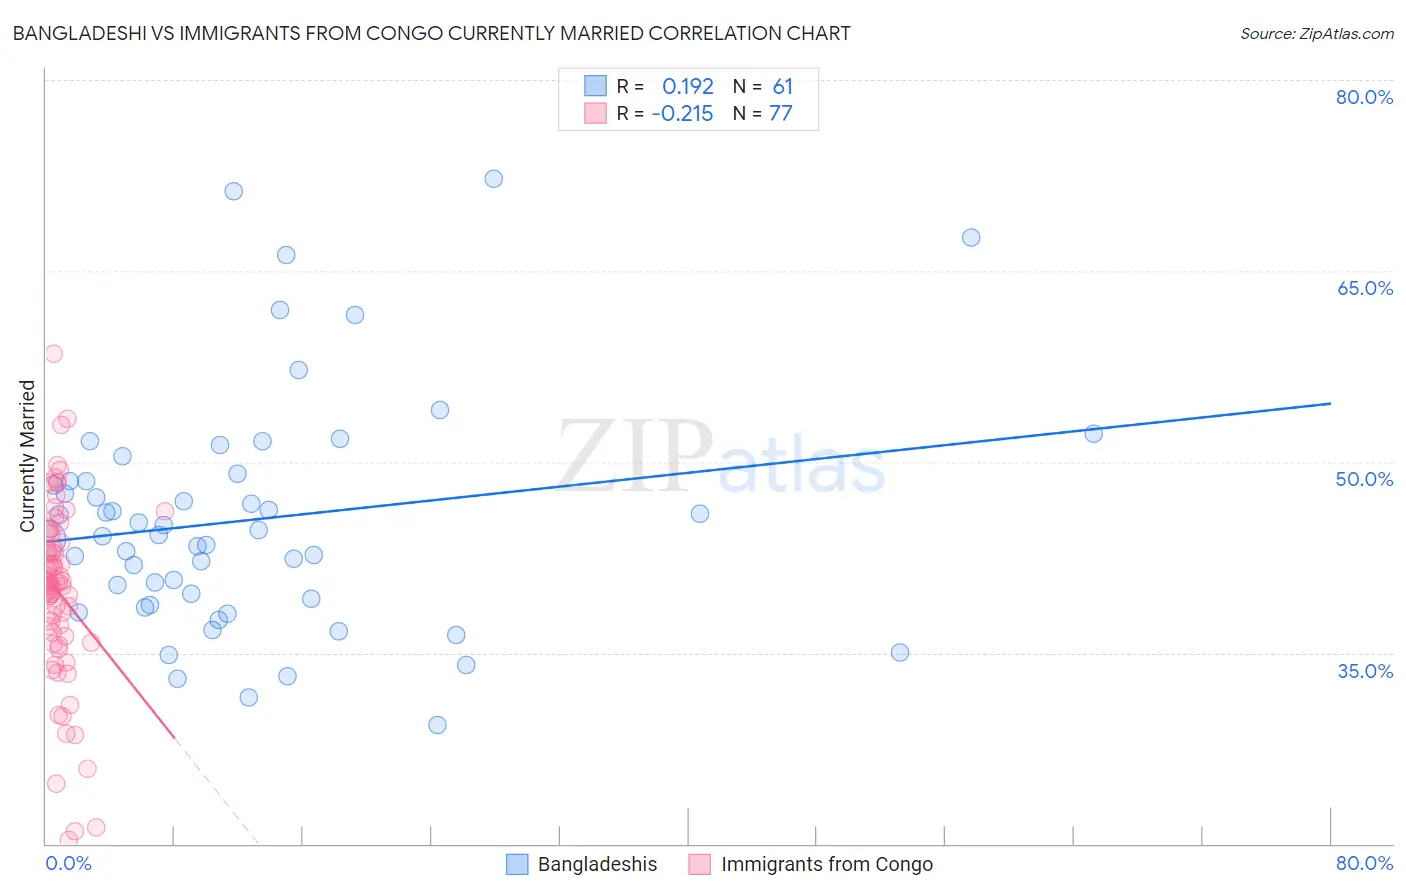
Bangladeshi vs Immigrants from Congo Currently Married Correlation Chart
The statistical analysis conducted on geographies consisting of 141,443,352 people shows a poor positive correlation between the proportion of Bangladeshis and percentage of population currently married in the United States with a correlation coefficient (R) of 0.192 and weighted average of 43.7%. Similarly, the statistical analysis conducted on geographies consisting of 92,127,634 people shows a weak negative correlation between the proportion of Immigrants from Congo and percentage of population currently married in the United States with a correlation coefficient (R) of -0.215 and weighted average of 41.1%, a difference of 6.4%.
Currently Married Correlation Summary
| Measurement | Bangladeshi | Immigrants from Congo |
| Minimum | 29.3% | 20.3% |
| Maximum | 72.2% | 58.5% |
| Range | 42.9% | 38.2% |
| Mean | 45.5% | 39.7% |
| Median | 44.3% | 40.3% |
| Interquartile 25% (IQ1) | 39.0% | 36.0% |
| Interquartile 75% (IQ3) | 48.8% | 44.0% |
| Interquartile Range (IQR) | 9.8% | 8.0% |
| Standard Deviation (Sample) | 9.3% | 7.2% |
| Standard Deviation (Population) | 9.2% | 7.2% |
Similar Demographics by Currently Married
Demographics Similar to Bangladeshis by Currently Married
In terms of currently married, the demographic groups most similar to Bangladeshis are Immigrants from Cuba (43.7%, a difference of 0.040%), Sudanese (43.7%, a difference of 0.050%), Immigrants from Nicaragua (43.7%, a difference of 0.14%), Immigrants from Bangladesh (43.6%, a difference of 0.14%), and Immigrants from Latin America (43.8%, a difference of 0.18%).
| Demographics | Rating | Rank | Currently Married |
| Yakama | 0.2 /100 | #255 | Tragic 44.0% |
| Shoshone | 0.2 /100 | #256 | Tragic 44.0% |
| Immigrants | Africa | 0.2 /100 | #257 | Tragic 43.9% |
| Ute | 0.2 /100 | #258 | Tragic 43.9% |
| Immigrants | Sierra Leone | 0.1 /100 | #259 | Tragic 43.8% |
| Immigrants | Latin America | 0.1 /100 | #260 | Tragic 43.8% |
| Immigrants | Nicaragua | 0.1 /100 | #261 | Tragic 43.7% |
| Bangladeshis | 0.1 /100 | #262 | Tragic 43.7% |
| Immigrants | Cuba | 0.1 /100 | #263 | Tragic 43.7% |
| Sudanese | 0.1 /100 | #264 | Tragic 43.7% |
| Immigrants | Bangladesh | 0.1 /100 | #265 | Tragic 43.6% |
| Ecuadorians | 0.1 /100 | #266 | Tragic 43.6% |
| Immigrants | Eritrea | 0.1 /100 | #267 | Tragic 43.6% |
| Spanish American Indians | 0.1 /100 | #268 | Tragic 43.6% |
| Immigrants | Sudan | 0.1 /100 | #269 | Tragic 43.5% |
Demographics Similar to Immigrants from Congo by Currently Married
In terms of currently married, the demographic groups most similar to Immigrants from Congo are Immigrants from Haiti (41.0%, a difference of 0.13%), Immigrants from Jamaica (41.1%, a difference of 0.23%), Immigrants from Somalia (41.2%, a difference of 0.29%), Bahamian (41.2%, a difference of 0.31%), and Haitian (41.3%, a difference of 0.49%).
| Demographics | Rating | Rank | Currently Married |
| West Indians | 0.0 /100 | #314 | Tragic 41.3% |
| Inupiat | 0.0 /100 | #315 | Tragic 41.3% |
| Immigrants | Caribbean | 0.0 /100 | #316 | Tragic 41.3% |
| Haitians | 0.0 /100 | #317 | Tragic 41.3% |
| Bahamians | 0.0 /100 | #318 | Tragic 41.2% |
| Immigrants | Somalia | 0.0 /100 | #319 | Tragic 41.2% |
| Immigrants | Jamaica | 0.0 /100 | #320 | Tragic 41.1% |
| Immigrants | Congo | 0.0 /100 | #321 | Tragic 41.1% |
| Immigrants | Haiti | 0.0 /100 | #322 | Tragic 41.0% |
| Immigrants | West Indies | 0.0 /100 | #323 | Tragic 40.7% |
| Immigrants | Senegal | 0.0 /100 | #324 | Tragic 40.7% |
| U.S. Virgin Islanders | 0.0 /100 | #325 | Tragic 40.7% |
| Barbadians | 0.0 /100 | #326 | Tragic 40.6% |
| Senegalese | 0.0 /100 | #327 | Tragic 40.6% |
| Arapaho | 0.0 /100 | #328 | Tragic 40.5% |