Bahamian vs Liberian Currently Married
COMPARE
Bahamian
Liberian
Currently Married
Currently Married Comparison
Bahamians
Liberians
41.2%
CURRENTLY MARRIED
0.0/ 100
METRIC RATING
318th/ 347
METRIC RANK
42.2%
CURRENTLY MARRIED
0.0/ 100
METRIC RATING
299th/ 347
METRIC RANK
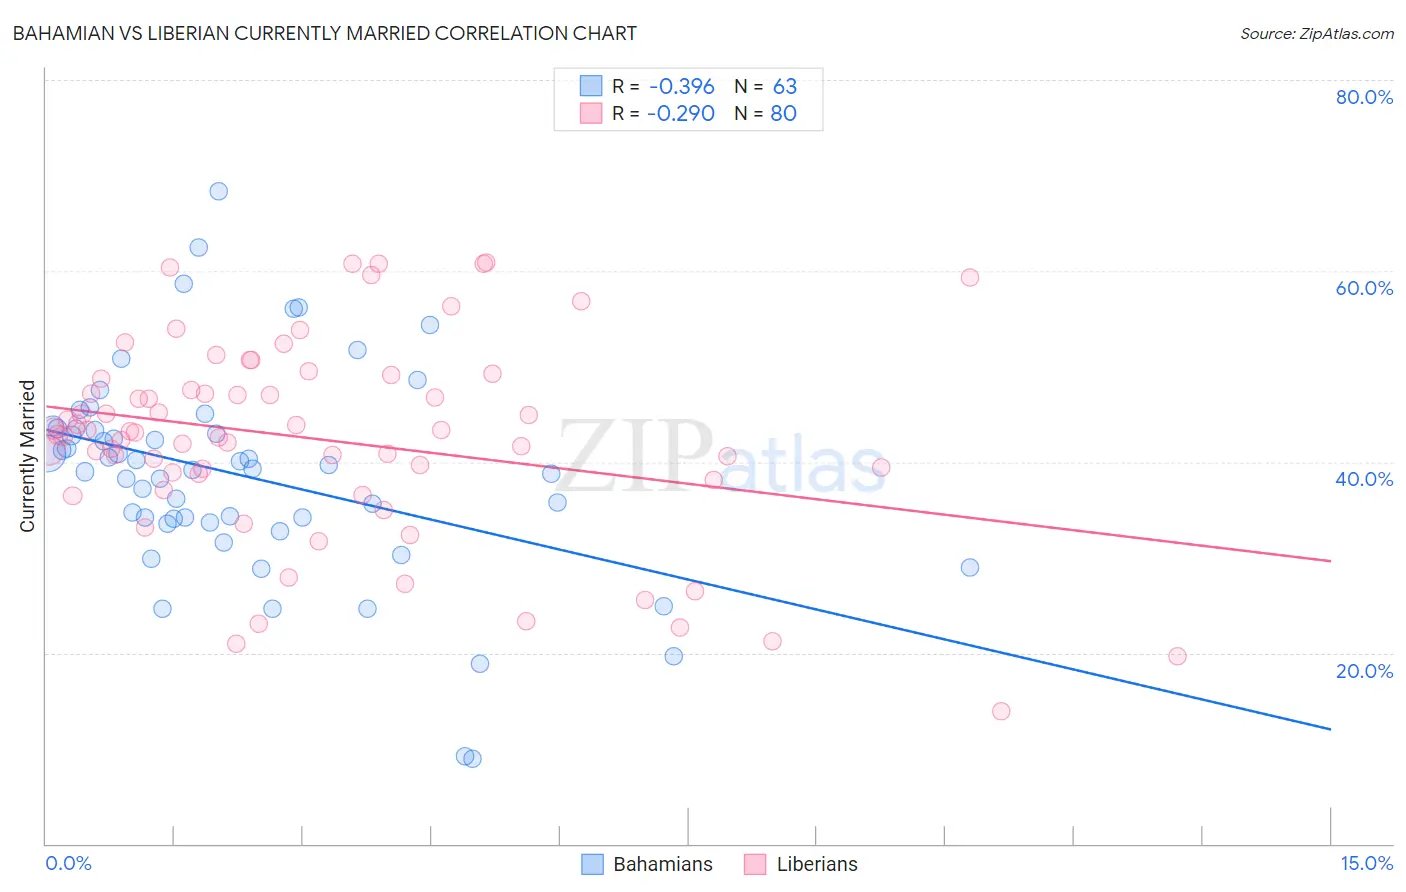
Bahamian vs Liberian Currently Married Correlation Chart
The statistical analysis conducted on geographies consisting of 112,687,531 people shows a mild negative correlation between the proportion of Bahamians and percentage of population currently married in the United States with a correlation coefficient (R) of -0.396 and weighted average of 41.2%. Similarly, the statistical analysis conducted on geographies consisting of 118,089,521 people shows a weak negative correlation between the proportion of Liberians and percentage of population currently married in the United States with a correlation coefficient (R) of -0.290 and weighted average of 42.2%, a difference of 2.5%.
Currently Married Correlation Summary
| Measurement | Bahamian | Liberian |
| Minimum | 8.9% | 13.9% |
| Maximum | 68.3% | 60.9% |
| Range | 59.4% | 47.0% |
| Mean | 38.6% | 42.3% |
| Median | 39.3% | 42.9% |
| Interquartile 25% (IQ1) | 33.7% | 38.4% |
| Interquartile 75% (IQ3) | 43.5% | 48.1% |
| Interquartile Range (IQR) | 9.8% | 9.7% |
| Standard Deviation (Sample) | 10.9% | 10.5% |
| Standard Deviation (Population) | 10.9% | 10.4% |
Demographics Similar to Bahamians and Liberians by Currently Married
In terms of currently married, the demographic groups most similar to Bahamians are Haitian (41.3%, a difference of 0.18%), Immigrants from Caribbean (41.3%, a difference of 0.20%), Inupiat (41.3%, a difference of 0.26%), West Indian (41.3%, a difference of 0.35%), and Jamaican (41.4%, a difference of 0.42%). Similarly, the demographic groups most similar to Liberians are Immigrants from Honduras (42.2%, a difference of 0.030%), Belizean (42.2%, a difference of 0.10%), Immigrants from Yemen (42.1%, a difference of 0.34%), Immigrants from Zaire (42.0%, a difference of 0.58%), and Sioux (41.9%, a difference of 0.59%).
| Demographics | Rating | Rank | Currently Married |
| Immigrants | Honduras | 0.0 /100 | #298 | Tragic 42.2% |
| Liberians | 0.0 /100 | #299 | Tragic 42.2% |
| Belizeans | 0.0 /100 | #300 | Tragic 42.2% |
| Immigrants | Yemen | 0.0 /100 | #301 | Tragic 42.1% |
| Immigrants | Zaire | 0.0 /100 | #302 | Tragic 42.0% |
| Sioux | 0.0 /100 | #303 | Tragic 41.9% |
| Immigrants | Bahamas | 0.0 /100 | #304 | Tragic 41.9% |
| Immigrants | Trinidad and Tobago | 0.0 /100 | #305 | Tragic 41.9% |
| Immigrants | Guyana | 0.0 /100 | #306 | Tragic 41.9% |
| Africans | 0.0 /100 | #307 | Tragic 41.8% |
| Immigrants | Belize | 0.0 /100 | #308 | Tragic 41.8% |
| Immigrants | Liberia | 0.0 /100 | #309 | Tragic 41.8% |
| Guyanese | 0.0 /100 | #310 | Tragic 41.6% |
| Trinidadians and Tobagonians | 0.0 /100 | #311 | Tragic 41.5% |
| Somalis | 0.0 /100 | #312 | Tragic 41.5% |
| Jamaicans | 0.0 /100 | #313 | Tragic 41.4% |
| West Indians | 0.0 /100 | #314 | Tragic 41.3% |
| Inupiat | 0.0 /100 | #315 | Tragic 41.3% |
| Immigrants | Caribbean | 0.0 /100 | #316 | Tragic 41.3% |
| Haitians | 0.0 /100 | #317 | Tragic 41.3% |
| Bahamians | 0.0 /100 | #318 | Tragic 41.2% |