Bahamian vs Asian Currently Married
COMPARE
Bahamian
Asian
Currently Married
Currently Married Comparison
Bahamians
Asians
41.2%
CURRENTLY MARRIED
0.0/ 100
METRIC RATING
318th/ 347
METRIC RANK
48.4%
CURRENTLY MARRIED
98.5/ 100
METRIC RATING
62nd/ 347
METRIC RANK
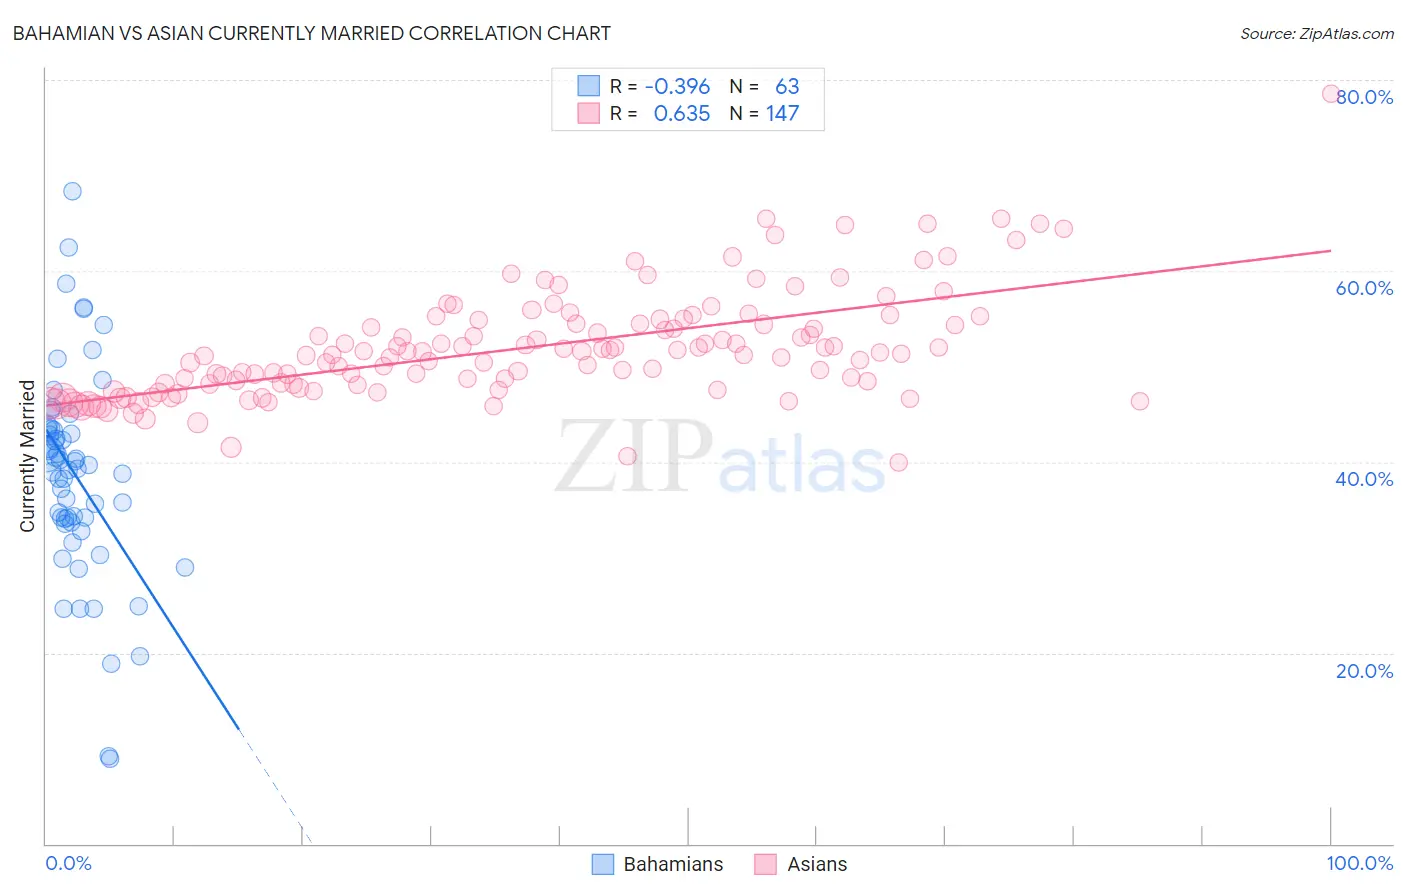
Bahamian vs Asian Currently Married Correlation Chart
The statistical analysis conducted on geographies consisting of 112,687,531 people shows a mild negative correlation between the proportion of Bahamians and percentage of population currently married in the United States with a correlation coefficient (R) of -0.396 and weighted average of 41.2%. Similarly, the statistical analysis conducted on geographies consisting of 550,785,629 people shows a significant positive correlation between the proportion of Asians and percentage of population currently married in the United States with a correlation coefficient (R) of 0.635 and weighted average of 48.4%, a difference of 17.6%.
Currently Married Correlation Summary
| Measurement | Bahamian | Asian |
| Minimum | 8.9% | 40.0% |
| Maximum | 68.3% | 78.5% |
| Range | 59.4% | 38.5% |
| Mean | 38.6% | 51.9% |
| Median | 39.3% | 51.4% |
| Interquartile 25% (IQ1) | 33.7% | 48.1% |
| Interquartile 75% (IQ3) | 43.5% | 54.5% |
| Interquartile Range (IQR) | 9.8% | 6.4% |
| Standard Deviation (Sample) | 10.9% | 5.7% |
| Standard Deviation (Population) | 10.9% | 5.7% |
Similar Demographics by Currently Married
Demographics Similar to Bahamians by Currently Married
In terms of currently married, the demographic groups most similar to Bahamians are Immigrants from Somalia (41.2%, a difference of 0.020%), Immigrants from Jamaica (41.1%, a difference of 0.080%), Haitian (41.3%, a difference of 0.18%), Immigrants from Caribbean (41.3%, a difference of 0.20%), and Inupiat (41.3%, a difference of 0.26%).
| Demographics | Rating | Rank | Currently Married |
| Trinidadians and Tobagonians | 0.0 /100 | #311 | Tragic 41.5% |
| Somalis | 0.0 /100 | #312 | Tragic 41.5% |
| Jamaicans | 0.0 /100 | #313 | Tragic 41.4% |
| West Indians | 0.0 /100 | #314 | Tragic 41.3% |
| Inupiat | 0.0 /100 | #315 | Tragic 41.3% |
| Immigrants | Caribbean | 0.0 /100 | #316 | Tragic 41.3% |
| Haitians | 0.0 /100 | #317 | Tragic 41.3% |
| Bahamians | 0.0 /100 | #318 | Tragic 41.2% |
| Immigrants | Somalia | 0.0 /100 | #319 | Tragic 41.2% |
| Immigrants | Jamaica | 0.0 /100 | #320 | Tragic 41.1% |
| Immigrants | Congo | 0.0 /100 | #321 | Tragic 41.1% |
| Immigrants | Haiti | 0.0 /100 | #322 | Tragic 41.0% |
| Immigrants | West Indies | 0.0 /100 | #323 | Tragic 40.7% |
| Immigrants | Senegal | 0.0 /100 | #324 | Tragic 40.7% |
| U.S. Virgin Islanders | 0.0 /100 | #325 | Tragic 40.7% |
Demographics Similar to Asians by Currently Married
In terms of currently married, the demographic groups most similar to Asians are Romanian (48.4%, a difference of 0.0%), Immigrants from Romania (48.4%, a difference of 0.010%), Immigrants from Ireland (48.4%, a difference of 0.030%), French (48.4%, a difference of 0.060%), and Immigrants from Netherlands (48.5%, a difference of 0.10%).
| Demographics | Rating | Rank | Currently Married |
| Immigrants | North Macedonia | 98.7 /100 | #55 | Exceptional 48.5% |
| Latvians | 98.7 /100 | #56 | Exceptional 48.5% |
| Immigrants | Netherlands | 98.6 /100 | #57 | Exceptional 48.5% |
| French | 98.6 /100 | #58 | Exceptional 48.4% |
| Immigrants | Ireland | 98.5 /100 | #59 | Exceptional 48.4% |
| Immigrants | Romania | 98.5 /100 | #60 | Exceptional 48.4% |
| Romanians | 98.5 /100 | #61 | Exceptional 48.4% |
| Asians | 98.5 /100 | #62 | Exceptional 48.4% |
| Slavs | 98.3 /100 | #63 | Exceptional 48.4% |
| Immigrants | Czechoslovakia | 98.3 /100 | #64 | Exceptional 48.4% |
| Ukrainians | 98.3 /100 | #65 | Exceptional 48.4% |
| Tongans | 98.2 /100 | #66 | Exceptional 48.3% |
| Slovaks | 98.2 /100 | #67 | Exceptional 48.3% |
| Immigrants | England | 98.2 /100 | #68 | Exceptional 48.3% |
| Canadians | 98.1 /100 | #69 | Exceptional 48.3% |