Asian vs Liberian Currently Married
COMPARE
Asian
Liberian
Currently Married
Currently Married Comparison
Asians
Liberians
48.4%
CURRENTLY MARRIED
98.5/ 100
METRIC RATING
62nd/ 347
METRIC RANK
42.2%
CURRENTLY MARRIED
0.0/ 100
METRIC RATING
299th/ 347
METRIC RANK
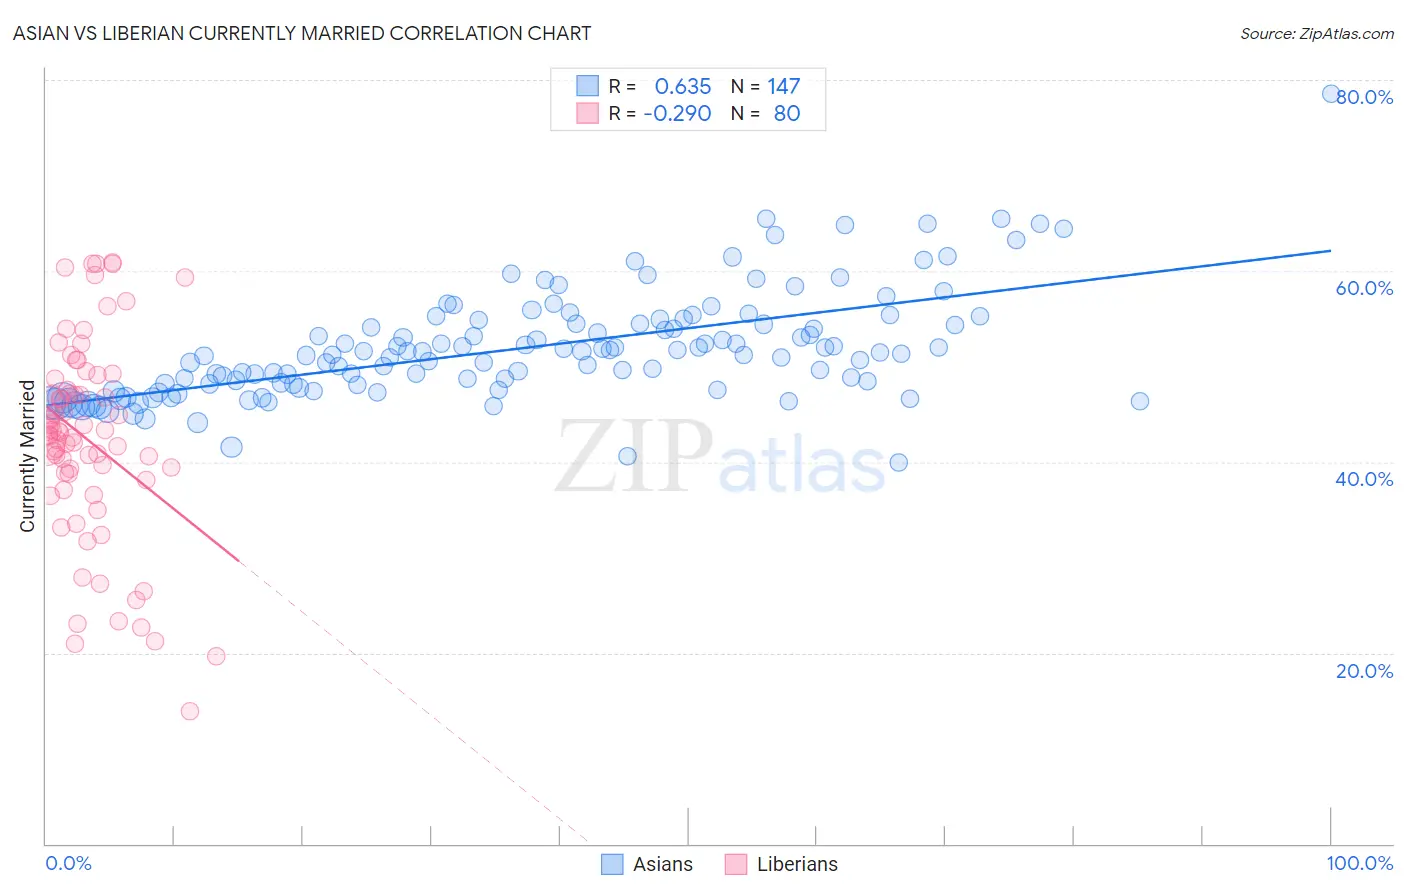
Asian vs Liberian Currently Married Correlation Chart
The statistical analysis conducted on geographies consisting of 550,785,629 people shows a significant positive correlation between the proportion of Asians and percentage of population currently married in the United States with a correlation coefficient (R) of 0.635 and weighted average of 48.4%. Similarly, the statistical analysis conducted on geographies consisting of 118,089,521 people shows a weak negative correlation between the proportion of Liberians and percentage of population currently married in the United States with a correlation coefficient (R) of -0.290 and weighted average of 42.2%, a difference of 14.7%.
Currently Married Correlation Summary
| Measurement | Asian | Liberian |
| Minimum | 40.0% | 13.9% |
| Maximum | 78.5% | 60.9% |
| Range | 38.5% | 47.0% |
| Mean | 51.9% | 42.3% |
| Median | 51.4% | 42.9% |
| Interquartile 25% (IQ1) | 48.1% | 38.4% |
| Interquartile 75% (IQ3) | 54.5% | 48.1% |
| Interquartile Range (IQR) | 6.4% | 9.7% |
| Standard Deviation (Sample) | 5.7% | 10.5% |
| Standard Deviation (Population) | 5.7% | 10.4% |
Similar Demographics by Currently Married
Demographics Similar to Asians by Currently Married
In terms of currently married, the demographic groups most similar to Asians are Romanian (48.4%, a difference of 0.0%), Immigrants from Romania (48.4%, a difference of 0.010%), Immigrants from Ireland (48.4%, a difference of 0.030%), French (48.4%, a difference of 0.060%), and Immigrants from Netherlands (48.5%, a difference of 0.10%).
| Demographics | Rating | Rank | Currently Married |
| Immigrants | North Macedonia | 98.7 /100 | #55 | Exceptional 48.5% |
| Latvians | 98.7 /100 | #56 | Exceptional 48.5% |
| Immigrants | Netherlands | 98.6 /100 | #57 | Exceptional 48.5% |
| French | 98.6 /100 | #58 | Exceptional 48.4% |
| Immigrants | Ireland | 98.5 /100 | #59 | Exceptional 48.4% |
| Immigrants | Romania | 98.5 /100 | #60 | Exceptional 48.4% |
| Romanians | 98.5 /100 | #61 | Exceptional 48.4% |
| Asians | 98.5 /100 | #62 | Exceptional 48.4% |
| Slavs | 98.3 /100 | #63 | Exceptional 48.4% |
| Immigrants | Czechoslovakia | 98.3 /100 | #64 | Exceptional 48.4% |
| Ukrainians | 98.3 /100 | #65 | Exceptional 48.4% |
| Tongans | 98.2 /100 | #66 | Exceptional 48.3% |
| Slovaks | 98.2 /100 | #67 | Exceptional 48.3% |
| Immigrants | England | 98.2 /100 | #68 | Exceptional 48.3% |
| Canadians | 98.1 /100 | #69 | Exceptional 48.3% |
Demographics Similar to Liberians by Currently Married
In terms of currently married, the demographic groups most similar to Liberians are Immigrants from Honduras (42.2%, a difference of 0.030%), Belizean (42.2%, a difference of 0.10%), Cheyenne (42.2%, a difference of 0.12%), Menominee (42.3%, a difference of 0.23%), and Immigrants from Yemen (42.1%, a difference of 0.34%).
| Demographics | Rating | Rank | Currently Married |
| Sub-Saharan Africans | 0.0 /100 | #292 | Tragic 42.6% |
| Yuman | 0.0 /100 | #293 | Tragic 42.6% |
| Hondurans | 0.0 /100 | #294 | Tragic 42.5% |
| Immigrants | Western Africa | 0.0 /100 | #295 | Tragic 42.4% |
| Menominee | 0.0 /100 | #296 | Tragic 42.3% |
| Cheyenne | 0.0 /100 | #297 | Tragic 42.2% |
| Immigrants | Honduras | 0.0 /100 | #298 | Tragic 42.2% |
| Liberians | 0.0 /100 | #299 | Tragic 42.2% |
| Belizeans | 0.0 /100 | #300 | Tragic 42.2% |
| Immigrants | Yemen | 0.0 /100 | #301 | Tragic 42.1% |
| Immigrants | Zaire | 0.0 /100 | #302 | Tragic 42.0% |
| Sioux | 0.0 /100 | #303 | Tragic 41.9% |
| Immigrants | Bahamas | 0.0 /100 | #304 | Tragic 41.9% |
| Immigrants | Trinidad and Tobago | 0.0 /100 | #305 | Tragic 41.9% |
| Immigrants | Guyana | 0.0 /100 | #306 | Tragic 41.9% |