Bahamian vs Tohono O'odham Currently Married
COMPARE
Bahamian
Tohono O'odham
Currently Married
Currently Married Comparison
Bahamians
Tohono O'odham
41.2%
CURRENTLY MARRIED
0.0/ 100
METRIC RATING
318th/ 347
METRIC RANK
36.8%
CURRENTLY MARRIED
0.0/ 100
METRIC RATING
345th/ 347
METRIC RANK
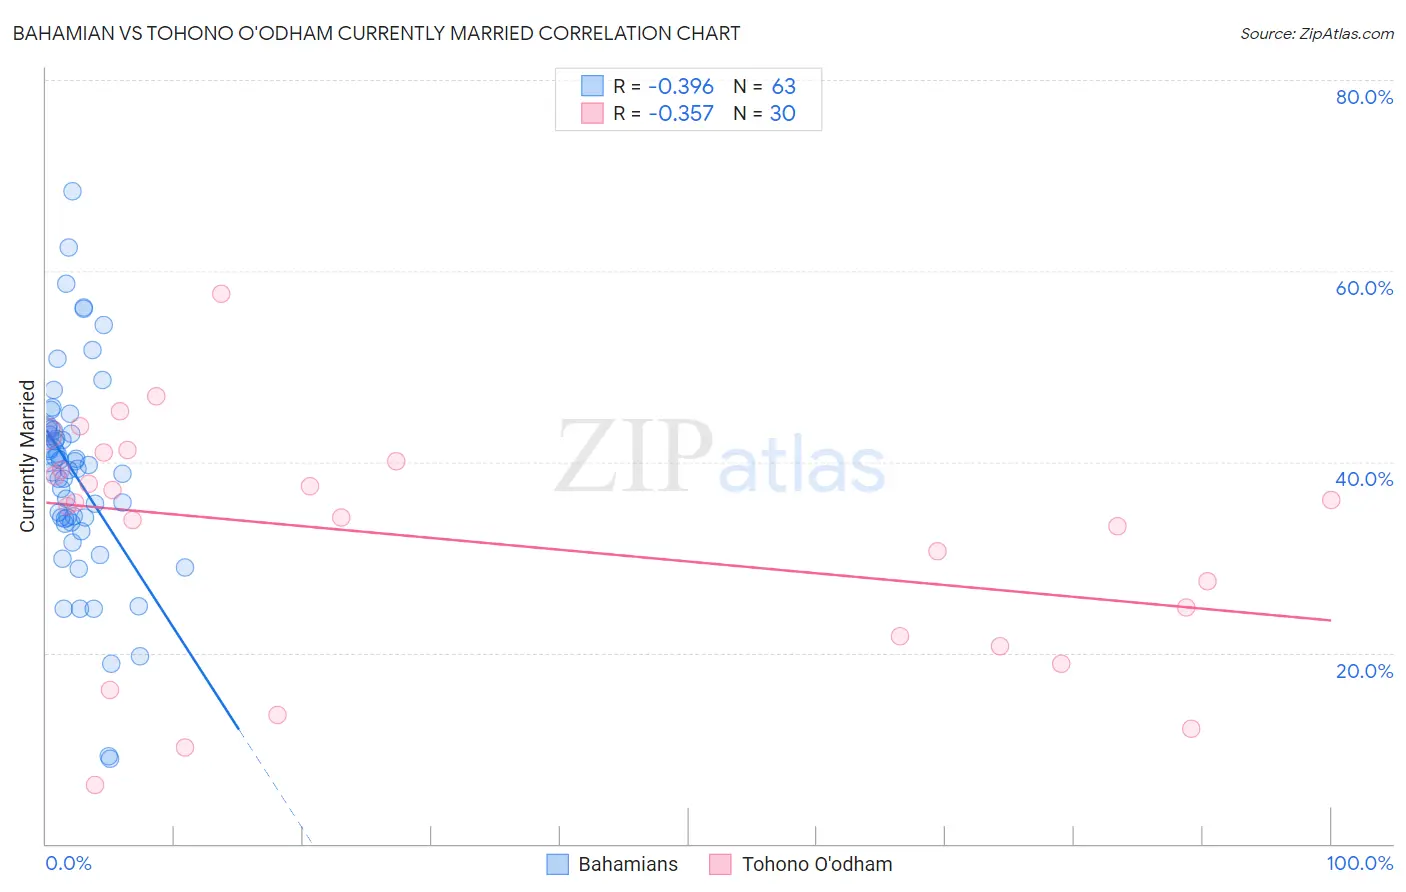
Bahamian vs Tohono O'odham Currently Married Correlation Chart
The statistical analysis conducted on geographies consisting of 112,687,531 people shows a mild negative correlation between the proportion of Bahamians and percentage of population currently married in the United States with a correlation coefficient (R) of -0.396 and weighted average of 41.2%. Similarly, the statistical analysis conducted on geographies consisting of 58,730,067 people shows a mild negative correlation between the proportion of Tohono O'odham and percentage of population currently married in the United States with a correlation coefficient (R) of -0.357 and weighted average of 36.8%, a difference of 12.0%.
Currently Married Correlation Summary
| Measurement | Bahamian | Tohono O'odham |
| Minimum | 8.9% | 6.2% |
| Maximum | 68.3% | 57.6% |
| Range | 59.4% | 51.4% |
| Mean | 38.6% | 32.0% |
| Median | 39.3% | 35.6% |
| Interquartile 25% (IQ1) | 33.7% | 21.8% |
| Interquartile 75% (IQ3) | 43.5% | 40.1% |
| Interquartile Range (IQR) | 9.8% | 18.3% |
| Standard Deviation (Sample) | 10.9% | 12.3% |
| Standard Deviation (Population) | 10.9% | 12.1% |
Similar Demographics by Currently Married
Demographics Similar to Bahamians by Currently Married
In terms of currently married, the demographic groups most similar to Bahamians are Immigrants from Somalia (41.2%, a difference of 0.020%), Immigrants from Jamaica (41.1%, a difference of 0.080%), Haitian (41.3%, a difference of 0.18%), Immigrants from Caribbean (41.3%, a difference of 0.20%), and Inupiat (41.3%, a difference of 0.26%).
| Demographics | Rating | Rank | Currently Married |
| Trinidadians and Tobagonians | 0.0 /100 | #311 | Tragic 41.5% |
| Somalis | 0.0 /100 | #312 | Tragic 41.5% |
| Jamaicans | 0.0 /100 | #313 | Tragic 41.4% |
| West Indians | 0.0 /100 | #314 | Tragic 41.3% |
| Inupiat | 0.0 /100 | #315 | Tragic 41.3% |
| Immigrants | Caribbean | 0.0 /100 | #316 | Tragic 41.3% |
| Haitians | 0.0 /100 | #317 | Tragic 41.3% |
| Bahamians | 0.0 /100 | #318 | Tragic 41.2% |
| Immigrants | Somalia | 0.0 /100 | #319 | Tragic 41.2% |
| Immigrants | Jamaica | 0.0 /100 | #320 | Tragic 41.1% |
| Immigrants | Congo | 0.0 /100 | #321 | Tragic 41.1% |
| Immigrants | Haiti | 0.0 /100 | #322 | Tragic 41.0% |
| Immigrants | West Indies | 0.0 /100 | #323 | Tragic 40.7% |
| Immigrants | Senegal | 0.0 /100 | #324 | Tragic 40.7% |
| U.S. Virgin Islanders | 0.0 /100 | #325 | Tragic 40.7% |
Demographics Similar to Tohono O'odham by Currently Married
In terms of currently married, the demographic groups most similar to Tohono O'odham are Hopi (36.5%, a difference of 0.58%), Pima (35.9%, a difference of 2.4%), Immigrants from Cabo Verde (37.8%, a difference of 2.9%), Pueblo (38.2%, a difference of 4.0%), and Immigrants from Dominican Republic (38.9%, a difference of 5.9%).
| Demographics | Rating | Rank | Currently Married |
| Yup'ik | 0.0 /100 | #333 | Tragic 39.9% |
| Puerto Ricans | 0.0 /100 | #334 | Tragic 39.9% |
| Lumbee | 0.0 /100 | #335 | Tragic 39.8% |
| British West Indians | 0.0 /100 | #336 | Tragic 39.8% |
| Blacks/African Americans | 0.0 /100 | #337 | Tragic 39.6% |
| Cape Verdeans | 0.0 /100 | #338 | Tragic 39.6% |
| Dominicans | 0.0 /100 | #339 | Tragic 39.5% |
| Immigrants | Grenada | 0.0 /100 | #340 | Tragic 39.1% |
| Navajo | 0.0 /100 | #341 | Tragic 39.0% |
| Immigrants | Dominican Republic | 0.0 /100 | #342 | Tragic 38.9% |
| Pueblo | 0.0 /100 | #343 | Tragic 38.2% |
| Immigrants | Cabo Verde | 0.0 /100 | #344 | Tragic 37.8% |
| Tohono O'odham | 0.0 /100 | #345 | Tragic 36.8% |
| Hopi | 0.0 /100 | #346 | Tragic 36.5% |
| Pima | 0.0 /100 | #347 | Tragic 35.9% |