Bahamian vs Liberian 10th Grade
COMPARE
Bahamian
Liberian
10th Grade
10th Grade Comparison
Bahamians
Liberians
93.1%
10TH GRADE
4.9/ 100
METRIC RATING
232nd/ 347
METRIC RANK
93.6%
10TH GRADE
34.7/ 100
METRIC RATING
187th/ 347
METRIC RANK
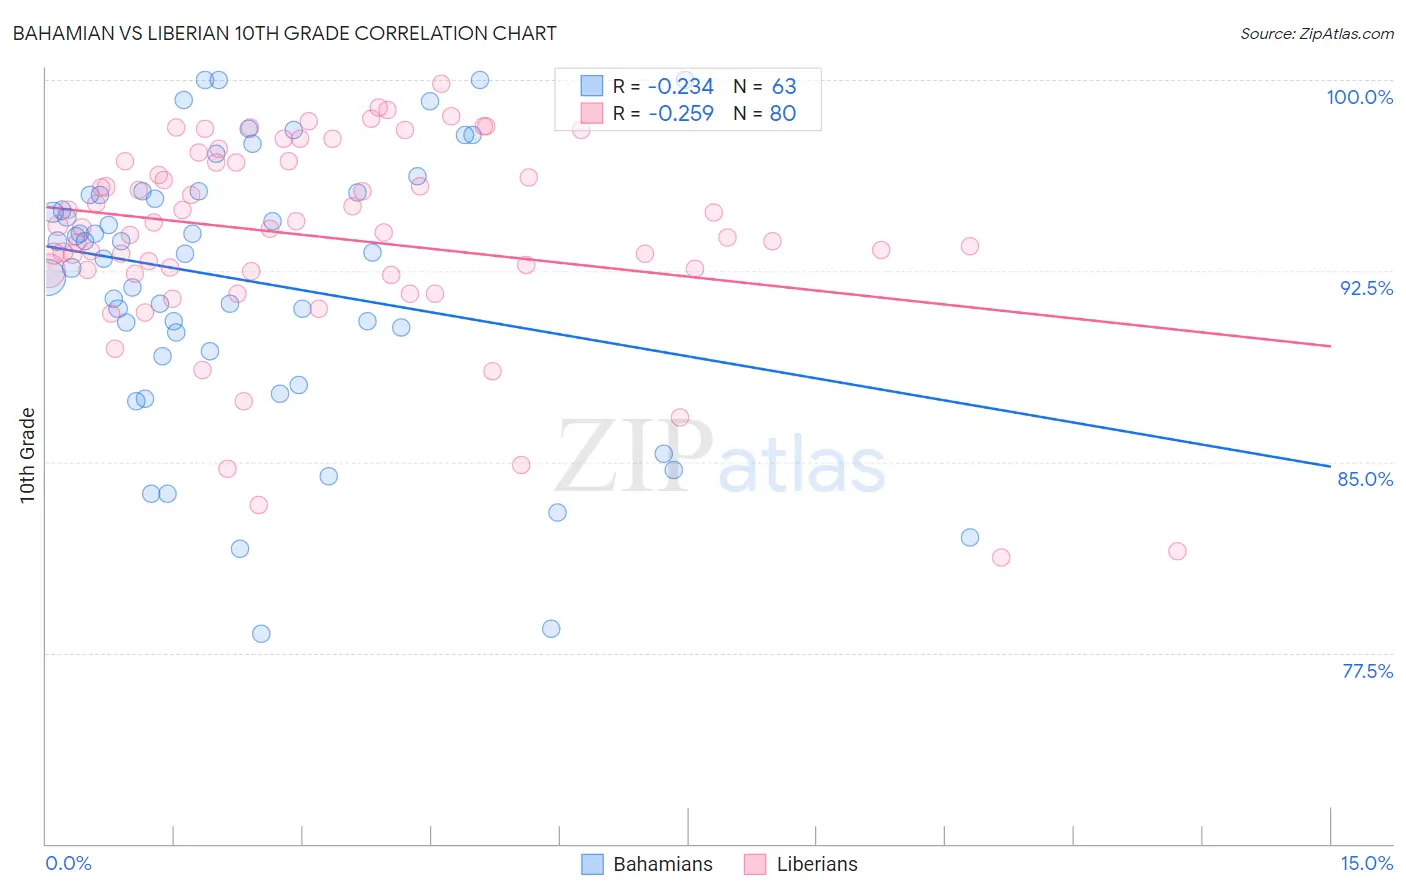
Bahamian vs Liberian 10th Grade Correlation Chart
The statistical analysis conducted on geographies consisting of 112,698,819 people shows a weak negative correlation between the proportion of Bahamians and percentage of population with at least 10th grade education in the United States with a correlation coefficient (R) of -0.234 and weighted average of 93.1%. Similarly, the statistical analysis conducted on geographies consisting of 118,103,458 people shows a weak negative correlation between the proportion of Liberians and percentage of population with at least 10th grade education in the United States with a correlation coefficient (R) of -0.259 and weighted average of 93.6%, a difference of 0.53%.
10th Grade Correlation Summary
| Measurement | Bahamian | Liberian |
| Minimum | 78.2% | 81.2% |
| Maximum | 100.0% | 99.8% |
| Range | 21.8% | 18.6% |
| Mean | 92.1% | 93.8% |
| Median | 93.2% | 94.2% |
| Interquartile 25% (IQ1) | 89.3% | 92.5% |
| Interquartile 75% (IQ3) | 95.6% | 96.8% |
| Interquartile Range (IQR) | 6.2% | 4.3% |
| Standard Deviation (Sample) | 5.3% | 4.0% |
| Standard Deviation (Population) | 5.3% | 3.9% |
Similar Demographics by 10th Grade
Demographics Similar to Bahamians by 10th Grade
In terms of 10th grade, the demographic groups most similar to Bahamians are South American Indian (93.1%, a difference of 0.0%), Comanche (93.1%, a difference of 0.0%), Immigrants from Ethiopia (93.1%, a difference of 0.010%), Immigrants from Africa (93.1%, a difference of 0.010%), and Subsaharan African (93.1%, a difference of 0.010%).
| Demographics | Rating | Rank | 10th Grade |
| Somalis | 6.2 /100 | #225 | Tragic 93.2% |
| Koreans | 6.1 /100 | #226 | Tragic 93.2% |
| Blacks/African Americans | 6.0 /100 | #227 | Tragic 93.2% |
| Immigrants | China | 5.9 /100 | #228 | Tragic 93.2% |
| Immigrants | Ethiopia | 5.1 /100 | #229 | Tragic 93.1% |
| Immigrants | Africa | 5.0 /100 | #230 | Tragic 93.1% |
| South American Indians | 4.9 /100 | #231 | Tragic 93.1% |
| Bahamians | 4.9 /100 | #232 | Tragic 93.1% |
| Comanche | 4.9 /100 | #233 | Tragic 93.1% |
| Sub-Saharan Africans | 4.7 /100 | #234 | Tragic 93.1% |
| Africans | 4.6 /100 | #235 | Tragic 93.1% |
| Afghans | 4.5 /100 | #236 | Tragic 93.1% |
| Immigrants | Panama | 4.3 /100 | #237 | Tragic 93.1% |
| Nigerians | 4.2 /100 | #238 | Tragic 93.1% |
| Costa Ricans | 4.2 /100 | #239 | Tragic 93.1% |
Demographics Similar to Liberians by 10th Grade
In terms of 10th grade, the demographic groups most similar to Liberians are Immigrants from Eastern Asia (93.6%, a difference of 0.0%), Guamanian/Chamorro (93.6%, a difference of 0.020%), Choctaw (93.6%, a difference of 0.020%), Sudanese (93.6%, a difference of 0.020%), and Marshallese (93.6%, a difference of 0.020%).
| Demographics | Rating | Rank | 10th Grade |
| Blackfeet | 42.8 /100 | #180 | Average 93.7% |
| Immigrants | Northern Africa | 41.6 /100 | #181 | Average 93.7% |
| Colville | 38.8 /100 | #182 | Fair 93.6% |
| Guamanians/Chamorros | 37.1 /100 | #183 | Fair 93.6% |
| Choctaw | 36.6 /100 | #184 | Fair 93.6% |
| Sudanese | 36.6 /100 | #185 | Fair 93.6% |
| Immigrants | Eastern Asia | 35.1 /100 | #186 | Fair 93.6% |
| Liberians | 34.7 /100 | #187 | Fair 93.6% |
| Marshallese | 33.2 /100 | #188 | Fair 93.6% |
| Immigrants | Pakistan | 32.5 /100 | #189 | Fair 93.6% |
| Laotians | 32.1 /100 | #190 | Fair 93.6% |
| Yup'ik | 31.1 /100 | #191 | Fair 93.6% |
| Immigrants | Malaysia | 28.0 /100 | #192 | Fair 93.5% |
| Panamanians | 28.0 /100 | #193 | Fair 93.5% |
| Immigrants | Morocco | 26.9 /100 | #194 | Fair 93.5% |