Black/African American vs Liberian Currently Married
COMPARE
Black/African American
Liberian
Currently Married
Currently Married Comparison
Blacks/African Americans
Liberians
39.6%
CURRENTLY MARRIED
0.0/ 100
METRIC RATING
337th/ 347
METRIC RANK
42.2%
CURRENTLY MARRIED
0.0/ 100
METRIC RATING
299th/ 347
METRIC RANK
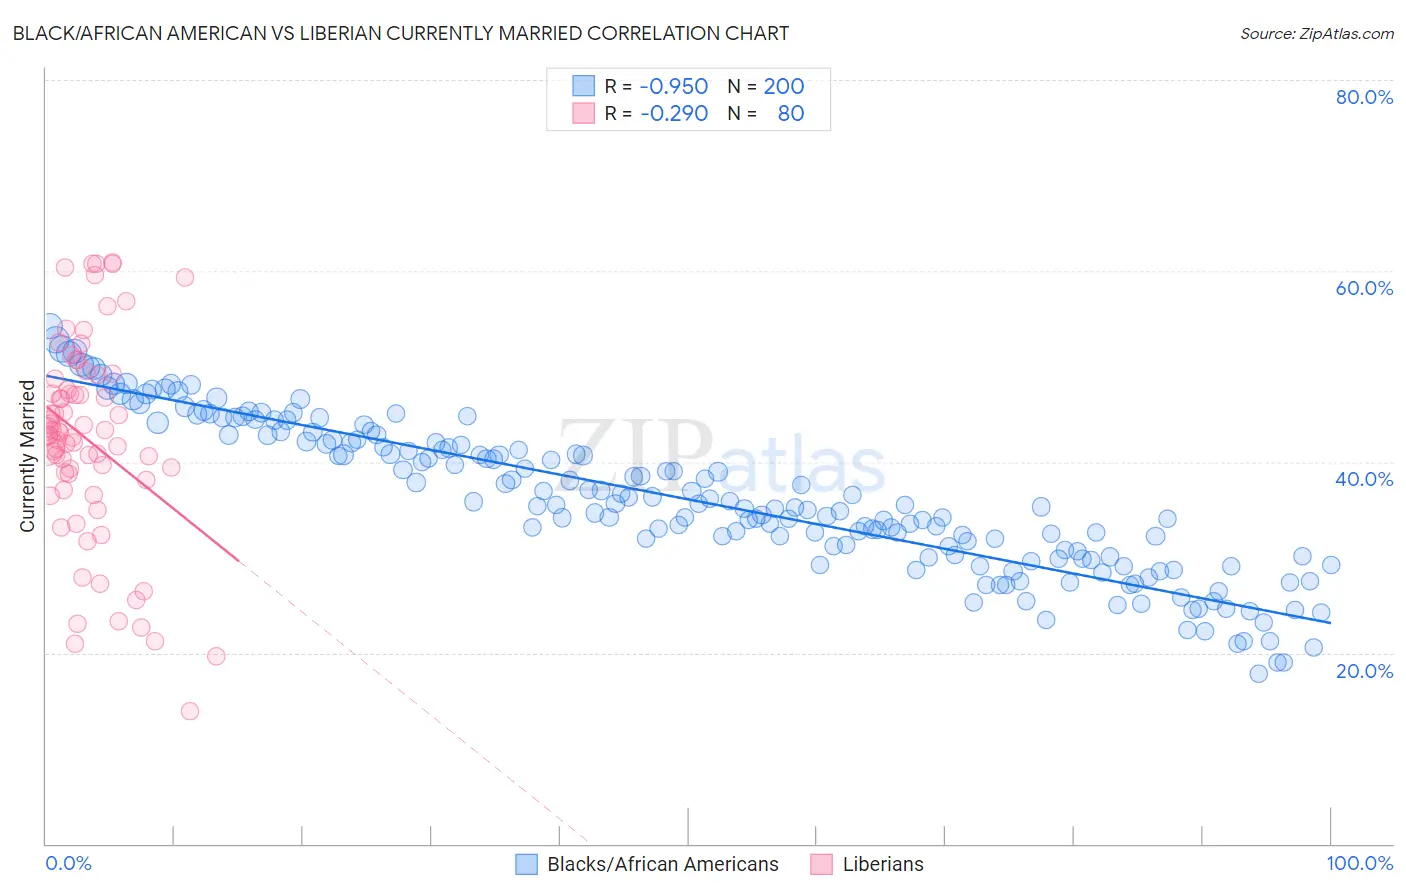
Black/African American vs Liberian Currently Married Correlation Chart
The statistical analysis conducted on geographies consisting of 565,898,128 people shows a near-perfect negative correlation between the proportion of Blacks/African Americans and percentage of population currently married in the United States with a correlation coefficient (R) of -0.950 and weighted average of 39.6%. Similarly, the statistical analysis conducted on geographies consisting of 118,089,521 people shows a weak negative correlation between the proportion of Liberians and percentage of population currently married in the United States with a correlation coefficient (R) of -0.290 and weighted average of 42.2%, a difference of 6.5%.
Currently Married Correlation Summary
| Measurement | Black/African American | Liberian |
| Minimum | 17.8% | 13.9% |
| Maximum | 54.2% | 60.9% |
| Range | 36.4% | 47.0% |
| Mean | 36.1% | 42.3% |
| Median | 35.4% | 42.9% |
| Interquartile 25% (IQ1) | 30.1% | 38.4% |
| Interquartile 75% (IQ3) | 42.1% | 48.1% |
| Interquartile Range (IQR) | 12.0% | 9.7% |
| Standard Deviation (Sample) | 7.9% | 10.5% |
| Standard Deviation (Population) | 7.9% | 10.4% |
Similar Demographics by Currently Married
Demographics Similar to Blacks/African Americans by Currently Married
In terms of currently married, the demographic groups most similar to Blacks/African Americans are Cape Verdean (39.6%, a difference of 0.090%), Dominican (39.5%, a difference of 0.25%), British West Indian (39.8%, a difference of 0.38%), Lumbee (39.8%, a difference of 0.56%), and Puerto Rican (39.9%, a difference of 0.72%).
| Demographics | Rating | Rank | Currently Married |
| Immigrants | Dominica | 0.0 /100 | #330 | Tragic 40.3% |
| Immigrants | Barbados | 0.0 /100 | #331 | Tragic 40.3% |
| Immigrants | St. Vincent and the Grenadines | 0.0 /100 | #332 | Tragic 40.1% |
| Yup'ik | 0.0 /100 | #333 | Tragic 39.9% |
| Puerto Ricans | 0.0 /100 | #334 | Tragic 39.9% |
| Lumbee | 0.0 /100 | #335 | Tragic 39.8% |
| British West Indians | 0.0 /100 | #336 | Tragic 39.8% |
| Blacks/African Americans | 0.0 /100 | #337 | Tragic 39.6% |
| Cape Verdeans | 0.0 /100 | #338 | Tragic 39.6% |
| Dominicans | 0.0 /100 | #339 | Tragic 39.5% |
| Immigrants | Grenada | 0.0 /100 | #340 | Tragic 39.1% |
| Navajo | 0.0 /100 | #341 | Tragic 39.0% |
| Immigrants | Dominican Republic | 0.0 /100 | #342 | Tragic 38.9% |
| Pueblo | 0.0 /100 | #343 | Tragic 38.2% |
| Immigrants | Cabo Verde | 0.0 /100 | #344 | Tragic 37.8% |
Demographics Similar to Liberians by Currently Married
In terms of currently married, the demographic groups most similar to Liberians are Immigrants from Honduras (42.2%, a difference of 0.030%), Belizean (42.2%, a difference of 0.10%), Cheyenne (42.2%, a difference of 0.12%), Menominee (42.3%, a difference of 0.23%), and Immigrants from Yemen (42.1%, a difference of 0.34%).
| Demographics | Rating | Rank | Currently Married |
| Sub-Saharan Africans | 0.0 /100 | #292 | Tragic 42.6% |
| Yuman | 0.0 /100 | #293 | Tragic 42.6% |
| Hondurans | 0.0 /100 | #294 | Tragic 42.5% |
| Immigrants | Western Africa | 0.0 /100 | #295 | Tragic 42.4% |
| Menominee | 0.0 /100 | #296 | Tragic 42.3% |
| Cheyenne | 0.0 /100 | #297 | Tragic 42.2% |
| Immigrants | Honduras | 0.0 /100 | #298 | Tragic 42.2% |
| Liberians | 0.0 /100 | #299 | Tragic 42.2% |
| Belizeans | 0.0 /100 | #300 | Tragic 42.2% |
| Immigrants | Yemen | 0.0 /100 | #301 | Tragic 42.1% |
| Immigrants | Zaire | 0.0 /100 | #302 | Tragic 42.0% |
| Sioux | 0.0 /100 | #303 | Tragic 41.9% |
| Immigrants | Bahamas | 0.0 /100 | #304 | Tragic 41.9% |
| Immigrants | Trinidad and Tobago | 0.0 /100 | #305 | Tragic 41.9% |
| Immigrants | Guyana | 0.0 /100 | #306 | Tragic 41.9% |