Bahamian vs Immigrants from Egypt Currently Married
COMPARE
Bahamian
Immigrants from Egypt
Currently Married
Currently Married Comparison
Bahamians
Immigrants from Egypt
41.2%
CURRENTLY MARRIED
0.0/ 100
METRIC RATING
318th/ 347
METRIC RANK
47.7%
CURRENTLY MARRIED
92.3/ 100
METRIC RATING
109th/ 347
METRIC RANK
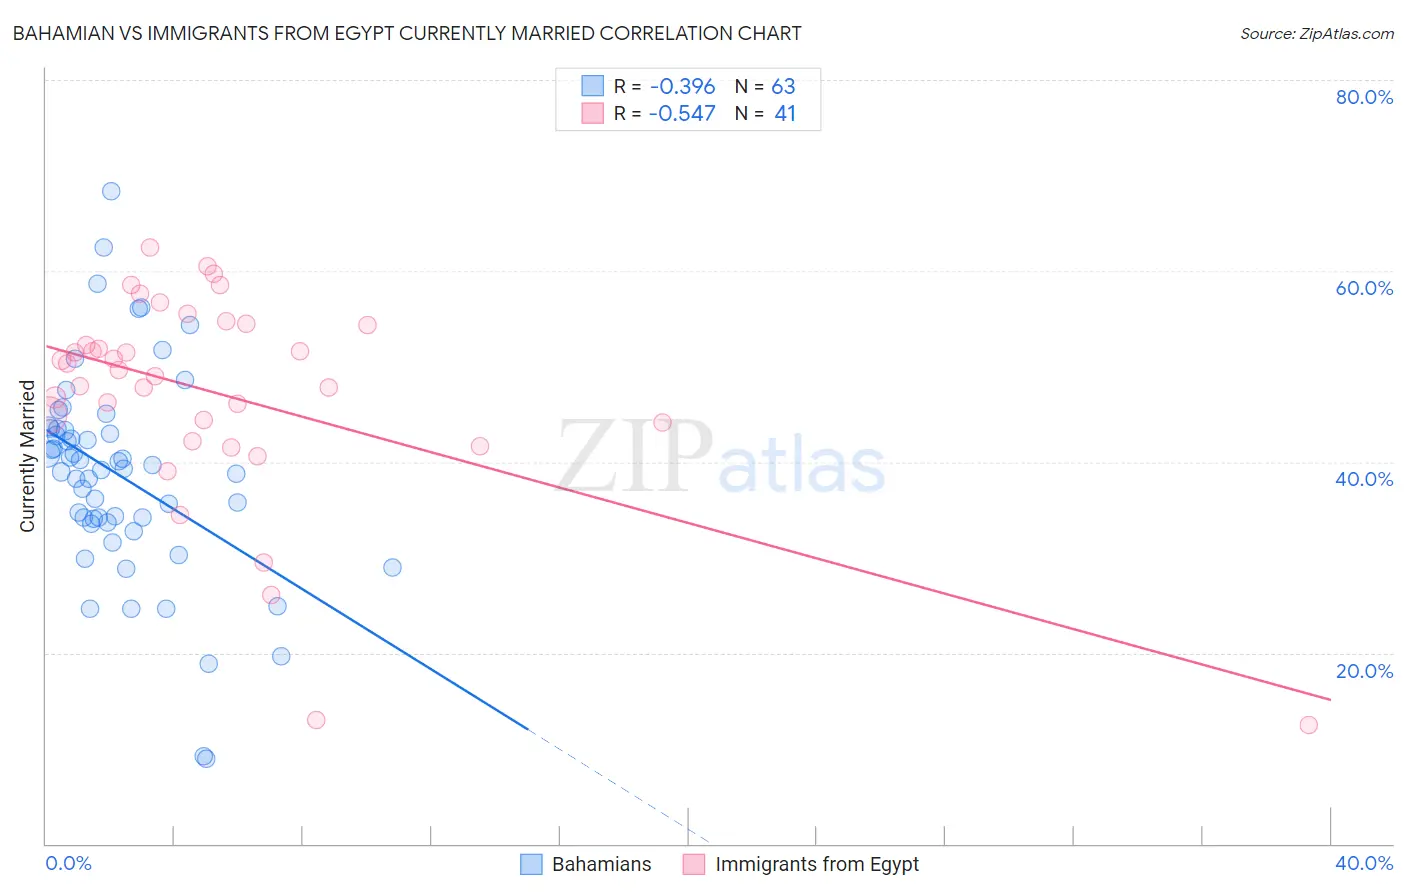
Bahamian vs Immigrants from Egypt Currently Married Correlation Chart
The statistical analysis conducted on geographies consisting of 112,687,531 people shows a mild negative correlation between the proportion of Bahamians and percentage of population currently married in the United States with a correlation coefficient (R) of -0.396 and weighted average of 41.2%. Similarly, the statistical analysis conducted on geographies consisting of 245,480,617 people shows a substantial negative correlation between the proportion of Immigrants from Egypt and percentage of population currently married in the United States with a correlation coefficient (R) of -0.547 and weighted average of 47.7%, a difference of 15.8%.
Currently Married Correlation Summary
| Measurement | Bahamian | Immigrants from Egypt |
| Minimum | 8.9% | 12.5% |
| Maximum | 68.3% | 62.5% |
| Range | 59.4% | 50.0% |
| Mean | 38.6% | 47.1% |
| Median | 39.3% | 49.7% |
| Interquartile 25% (IQ1) | 33.7% | 43.1% |
| Interquartile 75% (IQ3) | 43.5% | 54.5% |
| Interquartile Range (IQR) | 9.8% | 11.4% |
| Standard Deviation (Sample) | 10.9% | 11.1% |
| Standard Deviation (Population) | 10.9% | 11.0% |
Similar Demographics by Currently Married
Demographics Similar to Bahamians by Currently Married
In terms of currently married, the demographic groups most similar to Bahamians are Immigrants from Somalia (41.2%, a difference of 0.020%), Immigrants from Jamaica (41.1%, a difference of 0.080%), Haitian (41.3%, a difference of 0.18%), Immigrants from Caribbean (41.3%, a difference of 0.20%), and Inupiat (41.3%, a difference of 0.26%).
| Demographics | Rating | Rank | Currently Married |
| Trinidadians and Tobagonians | 0.0 /100 | #311 | Tragic 41.5% |
| Somalis | 0.0 /100 | #312 | Tragic 41.5% |
| Jamaicans | 0.0 /100 | #313 | Tragic 41.4% |
| West Indians | 0.0 /100 | #314 | Tragic 41.3% |
| Inupiat | 0.0 /100 | #315 | Tragic 41.3% |
| Immigrants | Caribbean | 0.0 /100 | #316 | Tragic 41.3% |
| Haitians | 0.0 /100 | #317 | Tragic 41.3% |
| Bahamians | 0.0 /100 | #318 | Tragic 41.2% |
| Immigrants | Somalia | 0.0 /100 | #319 | Tragic 41.2% |
| Immigrants | Jamaica | 0.0 /100 | #320 | Tragic 41.1% |
| Immigrants | Congo | 0.0 /100 | #321 | Tragic 41.1% |
| Immigrants | Haiti | 0.0 /100 | #322 | Tragic 41.0% |
| Immigrants | West Indies | 0.0 /100 | #323 | Tragic 40.7% |
| Immigrants | Senegal | 0.0 /100 | #324 | Tragic 40.7% |
| U.S. Virgin Islanders | 0.0 /100 | #325 | Tragic 40.7% |
Demographics Similar to Immigrants from Egypt by Currently Married
In terms of currently married, the demographic groups most similar to Immigrants from Egypt are Tsimshian (47.7%, a difference of 0.010%), Immigrants from Russia (47.7%, a difference of 0.040%), Immigrants from Italy (47.7%, a difference of 0.080%), Immigrants from Greece (47.7%, a difference of 0.11%), and Immigrants from Hungary (47.6%, a difference of 0.13%).
| Demographics | Rating | Rank | Currently Married |
| Turks | 93.9 /100 | #102 | Exceptional 47.8% |
| Cypriots | 93.7 /100 | #103 | Exceptional 47.8% |
| Serbians | 93.6 /100 | #104 | Exceptional 47.8% |
| Immigrants | Singapore | 93.3 /100 | #105 | Exceptional 47.8% |
| Immigrants | Greece | 93.1 /100 | #106 | Exceptional 47.7% |
| Immigrants | Italy | 92.9 /100 | #107 | Exceptional 47.7% |
| Tsimshian | 92.4 /100 | #108 | Exceptional 47.7% |
| Immigrants | Egypt | 92.3 /100 | #109 | Exceptional 47.7% |
| Immigrants | Russia | 92.0 /100 | #110 | Exceptional 47.7% |
| Immigrants | Hungary | 91.2 /100 | #111 | Exceptional 47.6% |
| Immigrants | Western Europe | 91.1 /100 | #112 | Exceptional 47.6% |
| Immigrants | Denmark | 90.9 /100 | #113 | Exceptional 47.6% |
| South Africans | 90.5 /100 | #114 | Exceptional 47.6% |
| Immigrants | Indonesia | 90.5 /100 | #115 | Exceptional 47.6% |
| Palestinians | 90.4 /100 | #116 | Exceptional 47.6% |