Immigrants from St. Vincent and the Grenadines vs Uruguayan Family Households
COMPARE
Immigrants from St. Vincent and the Grenadines
Uruguayan
Family Households
Family Households Comparison
Immigrants from St. Vincent and the Grenadines
Uruguayans
63.4%
FAMILY HOUSEHOLDS
1.9/ 100
METRIC RATING
241st/ 347
METRIC RANK
64.5%
FAMILY HOUSEHOLDS
67.7/ 100
METRIC RATING
155th/ 347
METRIC RANK
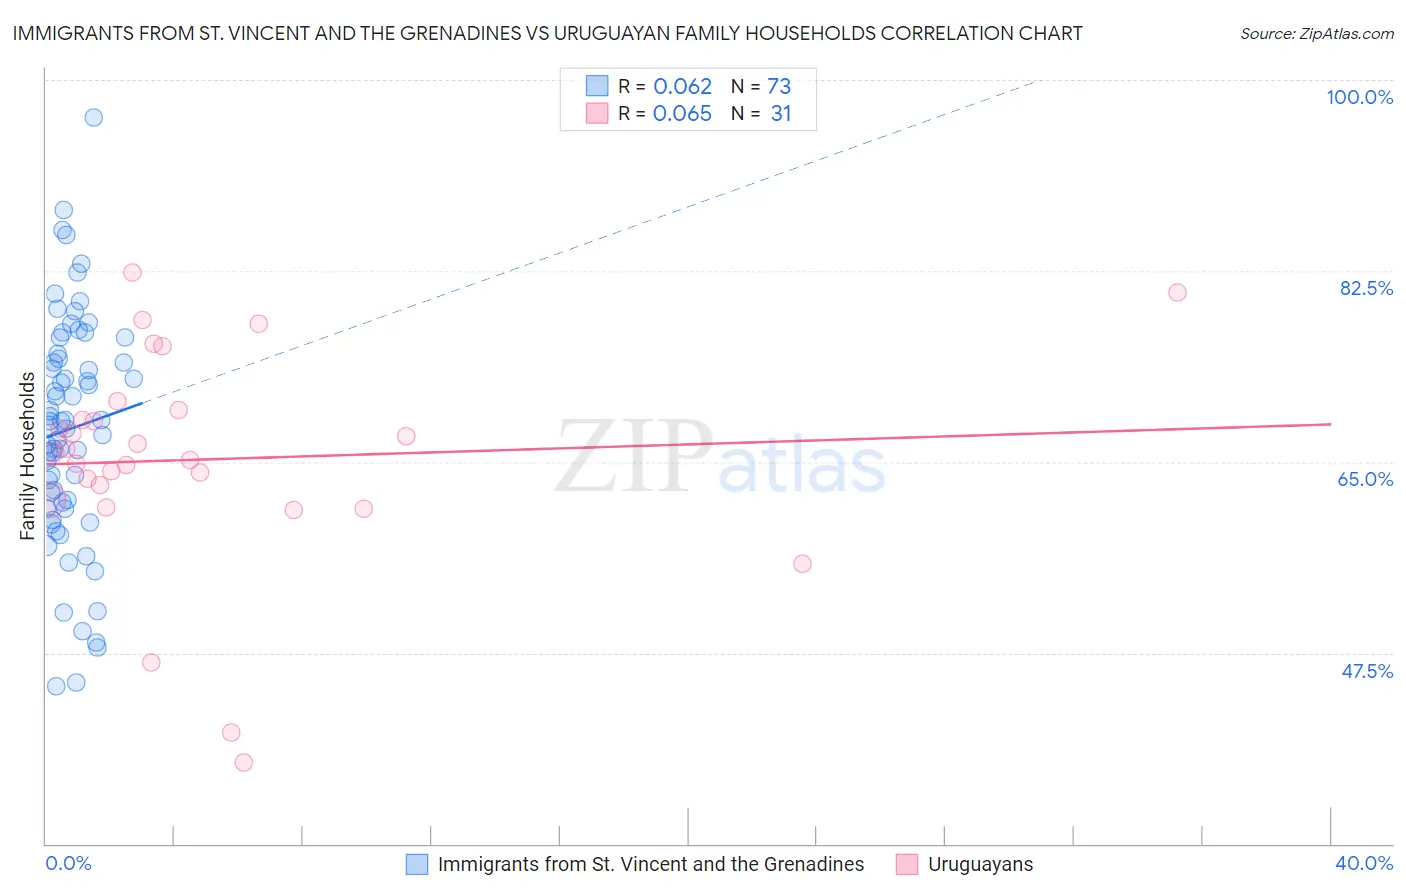
Immigrants from St. Vincent and the Grenadines vs Uruguayan Family Households Correlation Chart
The statistical analysis conducted on geographies consisting of 56,188,620 people shows a slight positive correlation between the proportion of Immigrants from St. Vincent and the Grenadines and percentage of family households in the United States with a correlation coefficient (R) of 0.062 and weighted average of 63.4%. Similarly, the statistical analysis conducted on geographies consisting of 144,759,449 people shows a slight positive correlation between the proportion of Uruguayans and percentage of family households in the United States with a correlation coefficient (R) of 0.065 and weighted average of 64.5%, a difference of 1.6%.
Family Households Correlation Summary
| Measurement | Immigrants from St. Vincent and the Grenadines | Uruguayan |
| Minimum | 44.5% | 37.5% |
| Maximum | 96.6% | 82.3% |
| Range | 52.1% | 44.8% |
| Mean | 68.0% | 65.2% |
| Median | 68.8% | 65.8% |
| Interquartile 25% (IQ1) | 61.0% | 61.5% |
| Interquartile 75% (IQ3) | 74.7% | 69.7% |
| Interquartile Range (IQR) | 13.7% | 8.2% |
| Standard Deviation (Sample) | 10.4% | 10.1% |
| Standard Deviation (Population) | 10.4% | 10.0% |
Similar Demographics by Family Households
Demographics Similar to Immigrants from St. Vincent and the Grenadines by Family Households
In terms of family households, the demographic groups most similar to Immigrants from St. Vincent and the Grenadines are Aleut (63.4%, a difference of 0.010%), South African (63.4%, a difference of 0.010%), Immigrants from Israel (63.4%, a difference of 0.010%), Immigrants from Czechoslovakia (63.4%, a difference of 0.020%), and Immigrants from Zimbabwe (63.5%, a difference of 0.030%).
| Demographics | Rating | Rank | Family Households |
| Finns | 2.3 /100 | #234 | Tragic 63.5% |
| Albanians | 2.2 /100 | #235 | Tragic 63.5% |
| Ghanaians | 2.1 /100 | #236 | Tragic 63.5% |
| Comanche | 2.1 /100 | #237 | Tragic 63.5% |
| Immigrants | Zimbabwe | 2.0 /100 | #238 | Tragic 63.5% |
| Aleuts | 1.9 /100 | #239 | Tragic 63.4% |
| South Africans | 1.9 /100 | #240 | Tragic 63.4% |
| Immigrants | St. Vincent and the Grenadines | 1.9 /100 | #241 | Tragic 63.4% |
| Immigrants | Israel | 1.8 /100 | #242 | Tragic 63.4% |
| Immigrants | Czechoslovakia | 1.8 /100 | #243 | Tragic 63.4% |
| Eastern Europeans | 1.6 /100 | #244 | Tragic 63.4% |
| Immigrants | Dominica | 1.6 /100 | #245 | Tragic 63.4% |
| Immigrants | Ghana | 1.6 /100 | #246 | Tragic 63.4% |
| Immigrants | Uzbekistan | 1.5 /100 | #247 | Tragic 63.4% |
| Dominicans | 1.5 /100 | #248 | Tragic 63.4% |
Demographics Similar to Uruguayans by Family Households
In terms of family households, the demographic groups most similar to Uruguayans are Austrian (64.5%, a difference of 0.010%), Czech (64.5%, a difference of 0.010%), Canadian (64.4%, a difference of 0.020%), Lebanese (64.4%, a difference of 0.020%), and Swedish (64.5%, a difference of 0.030%).
| Demographics | Rating | Rank | Family Households |
| Delaware | 76.3 /100 | #148 | Good 64.6% |
| Sioux | 76.3 /100 | #149 | Good 64.6% |
| Romanians | 75.3 /100 | #150 | Good 64.5% |
| Syrians | 75.2 /100 | #151 | Good 64.5% |
| Scottish | 70.9 /100 | #152 | Good 64.5% |
| Swedes | 69.8 /100 | #153 | Good 64.5% |
| Austrians | 68.5 /100 | #154 | Good 64.5% |
| Uruguayans | 67.7 /100 | #155 | Good 64.5% |
| Czechs | 67.0 /100 | #156 | Good 64.5% |
| Canadians | 66.6 /100 | #157 | Good 64.4% |
| Lebanese | 66.4 /100 | #158 | Good 64.4% |
| Germans | 65.8 /100 | #159 | Good 64.4% |
| Immigrants | Moldova | 65.2 /100 | #160 | Good 64.4% |
| Immigrants | England | 62.6 /100 | #161 | Good 64.4% |
| British | 61.6 /100 | #162 | Good 64.4% |