Immigrants from Bulgaria vs Salvadoran Family Households
COMPARE
Immigrants from Bulgaria
Salvadoran
Family Households
Family Households Comparison
Immigrants from Bulgaria
Salvadorans
63.0%
FAMILY HOUSEHOLDS
0.2/ 100
METRIC RATING
280th/ 347
METRIC RANK
67.2%
FAMILY HOUSEHOLDS
100.0/ 100
METRIC RATING
33rd/ 347
METRIC RANK
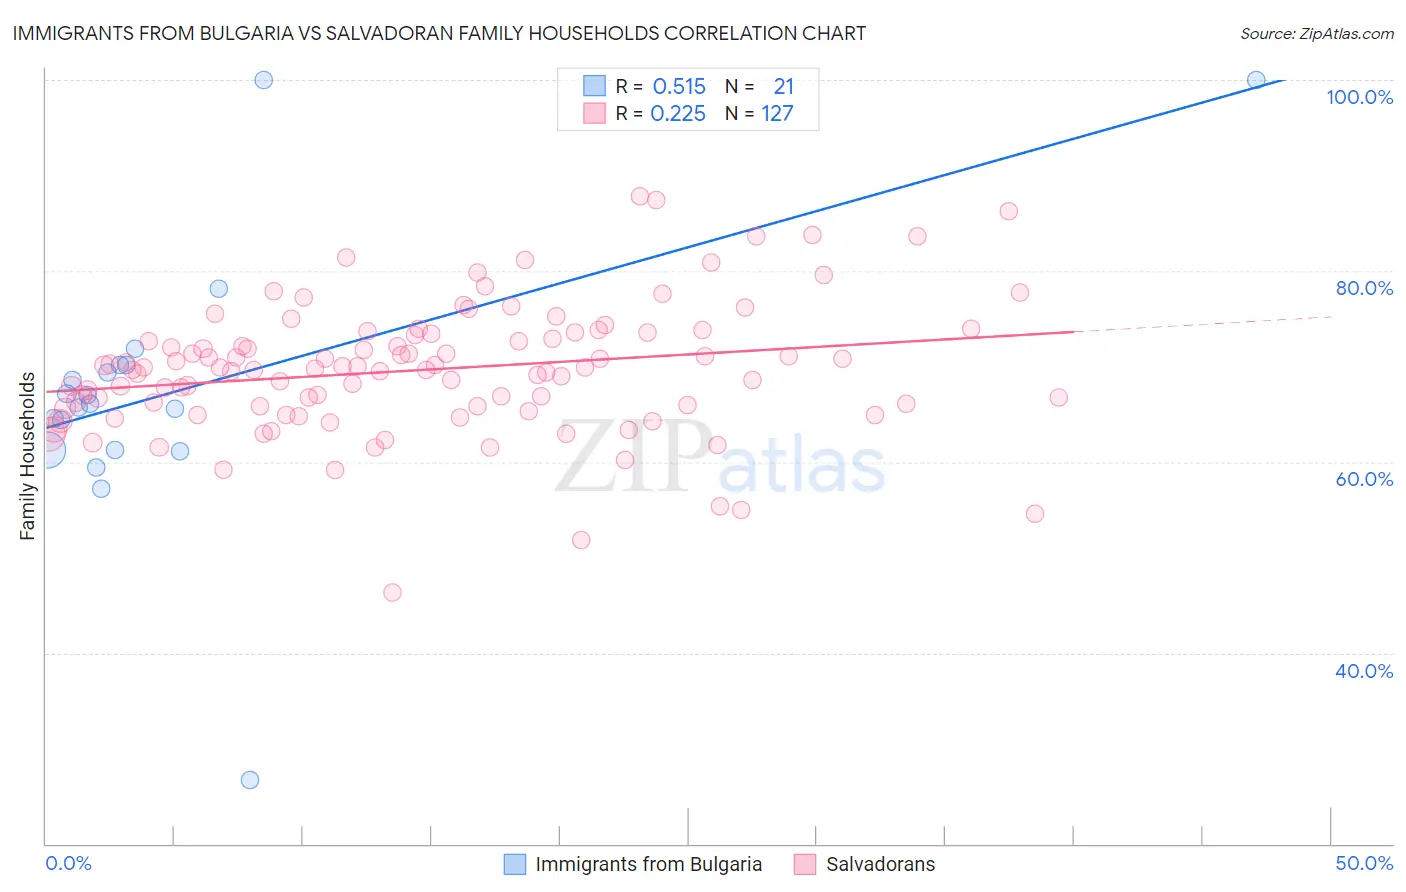
Immigrants from Bulgaria vs Salvadoran Family Households Correlation Chart
The statistical analysis conducted on geographies consisting of 172,541,029 people shows a substantial positive correlation between the proportion of Immigrants from Bulgaria and percentage of family households in the United States with a correlation coefficient (R) of 0.515 and weighted average of 63.0%. Similarly, the statistical analysis conducted on geographies consisting of 398,699,924 people shows a weak positive correlation between the proportion of Salvadorans and percentage of family households in the United States with a correlation coefficient (R) of 0.225 and weighted average of 67.2%, a difference of 6.7%.
Family Households Correlation Summary
| Measurement | Immigrants from Bulgaria | Salvadoran |
| Minimum | 26.6% | 46.4% |
| Maximum | 100.0% | 87.9% |
| Range | 73.4% | 41.5% |
| Mean | 67.4% | 69.7% |
| Median | 66.1% | 69.8% |
| Interquartile 25% (IQ1) | 61.2% | 65.8% |
| Interquartile 75% (IQ3) | 70.1% | 73.5% |
| Interquartile Range (IQR) | 8.9% | 7.6% |
| Standard Deviation (Sample) | 14.6% | 6.8% |
| Standard Deviation (Population) | 14.2% | 6.8% |
Similar Demographics by Family Households
Demographics Similar to Immigrants from Bulgaria by Family Households
In terms of family households, the demographic groups most similar to Immigrants from Bulgaria are Immigrants from Yemen (63.0%, a difference of 0.010%), Immigrants from Belgium (63.0%, a difference of 0.050%), Ottawa (63.0%, a difference of 0.090%), Estonian (62.9%, a difference of 0.090%), and New Zealander (62.9%, a difference of 0.13%).
| Demographics | Rating | Rank | Family Households |
| Immigrants | Kazakhstan | 0.3 /100 | #273 | Tragic 63.1% |
| Lumbee | 0.3 /100 | #274 | Tragic 63.1% |
| West Indians | 0.3 /100 | #275 | Tragic 63.1% |
| Serbians | 0.3 /100 | #276 | Tragic 63.0% |
| Ottawa | 0.3 /100 | #277 | Tragic 63.0% |
| Immigrants | Belgium | 0.2 /100 | #278 | Tragic 63.0% |
| Immigrants | Yemen | 0.2 /100 | #279 | Tragic 63.0% |
| Immigrants | Bulgaria | 0.2 /100 | #280 | Tragic 63.0% |
| Estonians | 0.2 /100 | #281 | Tragic 62.9% |
| New Zealanders | 0.1 /100 | #282 | Tragic 62.9% |
| Immigrants | Denmark | 0.1 /100 | #283 | Tragic 62.9% |
| Australians | 0.1 /100 | #284 | Tragic 62.8% |
| Mongolians | 0.1 /100 | #285 | Tragic 62.8% |
| British West Indians | 0.1 /100 | #286 | Tragic 62.8% |
| Latvians | 0.1 /100 | #287 | Tragic 62.8% |
Demographics Similar to Salvadorans by Family Households
In terms of family households, the demographic groups most similar to Salvadorans are Thai (67.2%, a difference of 0.0%), Nepalese (67.2%, a difference of 0.040%), Tohono O'odham (67.1%, a difference of 0.050%), Peruvian (67.1%, a difference of 0.060%), and Immigrants from Latin America (67.2%, a difference of 0.10%).
| Demographics | Rating | Rank | Family Households |
| Immigrants | India | 100.0 /100 | #26 | Exceptional 67.4% |
| Hispanics or Latinos | 100.0 /100 | #27 | Exceptional 67.4% |
| Hawaiians | 100.0 /100 | #28 | Exceptional 67.4% |
| Nicaraguans | 100.0 /100 | #29 | Exceptional 67.4% |
| Immigrants | Peru | 100.0 /100 | #30 | Exceptional 67.2% |
| Immigrants | Latin America | 100.0 /100 | #31 | Exceptional 67.2% |
| Nepalese | 100.0 /100 | #32 | Exceptional 67.2% |
| Salvadorans | 100.0 /100 | #33 | Exceptional 67.2% |
| Thais | 100.0 /100 | #34 | Exceptional 67.2% |
| Tohono O'odham | 100.0 /100 | #35 | Exceptional 67.1% |
| Peruvians | 100.0 /100 | #36 | Exceptional 67.1% |
| Tsimshian | 100.0 /100 | #37 | Exceptional 67.1% |
| Mexican American Indians | 100.0 /100 | #38 | Exceptional 67.0% |
| Immigrants | El Salvador | 100.0 /100 | #39 | Exceptional 67.0% |
| Guamanians/Chamorros | 100.0 /100 | #40 | Exceptional 66.6% |