Immigrants from Scotland vs Ottawa Average Family Size
COMPARE
Immigrants from Scotland
Ottawa
Average Family Size
Average Family Size Comparison
Immigrants from Scotland
Ottawa
3.12
AVERAGE FAMILY SIZE
0.1/ 100
METRIC RATING
315th/ 347
METRIC RANK
3.11
AVERAGE FAMILY SIZE
0.0/ 100
METRIC RATING
326th/ 347
METRIC RANK
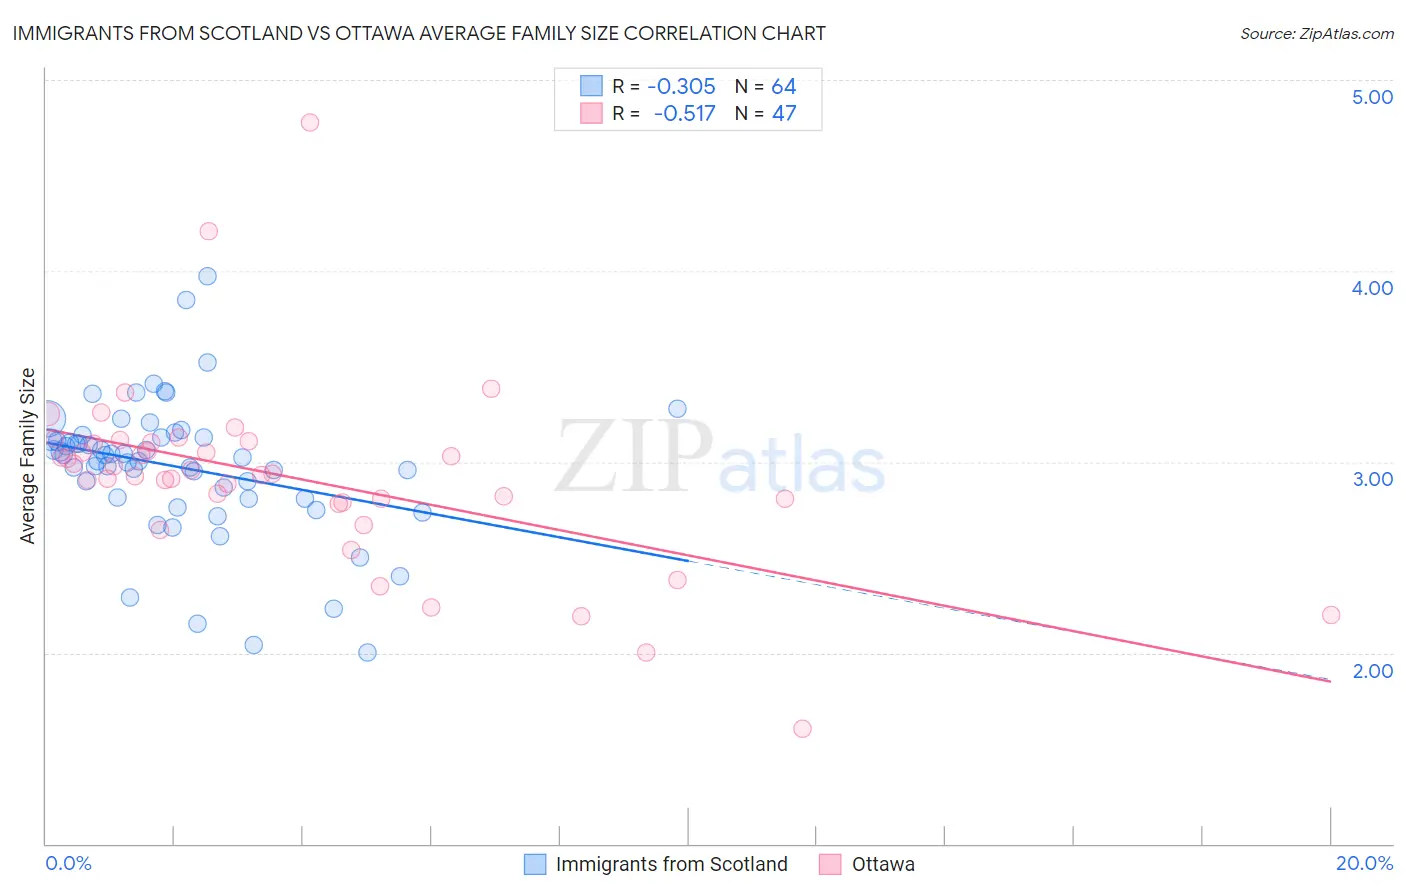
Immigrants from Scotland vs Ottawa Average Family Size Correlation Chart
The statistical analysis conducted on geographies consisting of 196,383,417 people shows a mild negative correlation between the proportion of Immigrants from Scotland and average family size in the United States with a correlation coefficient (R) of -0.305 and weighted average of 3.12. Similarly, the statistical analysis conducted on geographies consisting of 49,944,420 people shows a substantial negative correlation between the proportion of Ottawa and average family size in the United States with a correlation coefficient (R) of -0.517 and weighted average of 3.11, a difference of 0.46%.
Average Family Size Correlation Summary
| Measurement | Immigrants from Scotland | Ottawa |
| Minimum | 2.00 | 1.60 |
| Maximum | 3.97 | 4.78 |
| Range | 1.97 | 3.18 |
| Mean | 2.97 | 2.92 |
| Median | 3.03 | 2.94 |
| Interquartile 25% (IQ1) | 2.81 | 2.79 |
| Interquartile 75% (IQ3) | 3.13 | 3.10 |
| Interquartile Range (IQR) | 0.32 | 0.31 |
| Standard Deviation (Sample) | 0.36 | 0.49 |
| Standard Deviation (Population) | 0.36 | 0.49 |
Demographics Similar to Immigrants from Scotland and Ottawa by Average Family Size
In terms of average family size, the demographic groups most similar to Immigrants from Scotland are Russian (3.12, a difference of 0.020%), Immigrants from Australia (3.13, a difference of 0.060%), Bulgarian (3.13, a difference of 0.060%), Immigrants from Northern Europe (3.13, a difference of 0.090%), and Serbian (3.12, a difference of 0.090%). Similarly, the demographic groups most similar to Ottawa are Dutch (3.11, a difference of 0.010%), Czech (3.11, a difference of 0.010%), English (3.11, a difference of 0.050%), Belgian (3.11, a difference of 0.070%), and Celtic (3.11, a difference of 0.090%).
| Demographics | Rating | Rank | Average Family Size |
| Czechoslovakians | 0.1 /100 | #310 | Tragic 3.13 |
| Immigrants | Northern Europe | 0.1 /100 | #311 | Tragic 3.13 |
| Immigrants | Australia | 0.1 /100 | #312 | Tragic 3.13 |
| Bulgarians | 0.1 /100 | #313 | Tragic 3.13 |
| Russians | 0.1 /100 | #314 | Tragic 3.12 |
| Immigrants | Scotland | 0.1 /100 | #315 | Tragic 3.12 |
| Serbians | 0.1 /100 | #316 | Tragic 3.12 |
| Italians | 0.1 /100 | #317 | Tragic 3.12 |
| Eastern Europeans | 0.1 /100 | #318 | Tragic 3.12 |
| Welsh | 0.1 /100 | #319 | Tragic 3.12 |
| Immigrants | North America | 0.0 /100 | #320 | Tragic 3.12 |
| Immigrants | Austria | 0.0 /100 | #321 | Tragic 3.12 |
| Immigrants | Canada | 0.0 /100 | #322 | Tragic 3.12 |
| Soviet Union | 0.0 /100 | #323 | Tragic 3.11 |
| Celtics | 0.0 /100 | #324 | Tragic 3.11 |
| English | 0.0 /100 | #325 | Tragic 3.11 |
| Ottawa | 0.0 /100 | #326 | Tragic 3.11 |
| Dutch | 0.0 /100 | #327 | Tragic 3.11 |
| Czechs | 0.0 /100 | #328 | Tragic 3.11 |
| Belgians | 0.0 /100 | #329 | Tragic 3.11 |
| Latvians | 0.0 /100 | #330 | Tragic 3.11 |