Liberian vs Ottawa Average Family Size
COMPARE
Liberian
Ottawa
Average Family Size
Average Family Size Comparison
Liberians
Ottawa
3.25
AVERAGE FAMILY SIZE
81.2/ 100
METRIC RATING
142nd/ 347
METRIC RANK
3.11
AVERAGE FAMILY SIZE
0.0/ 100
METRIC RATING
326th/ 347
METRIC RANK
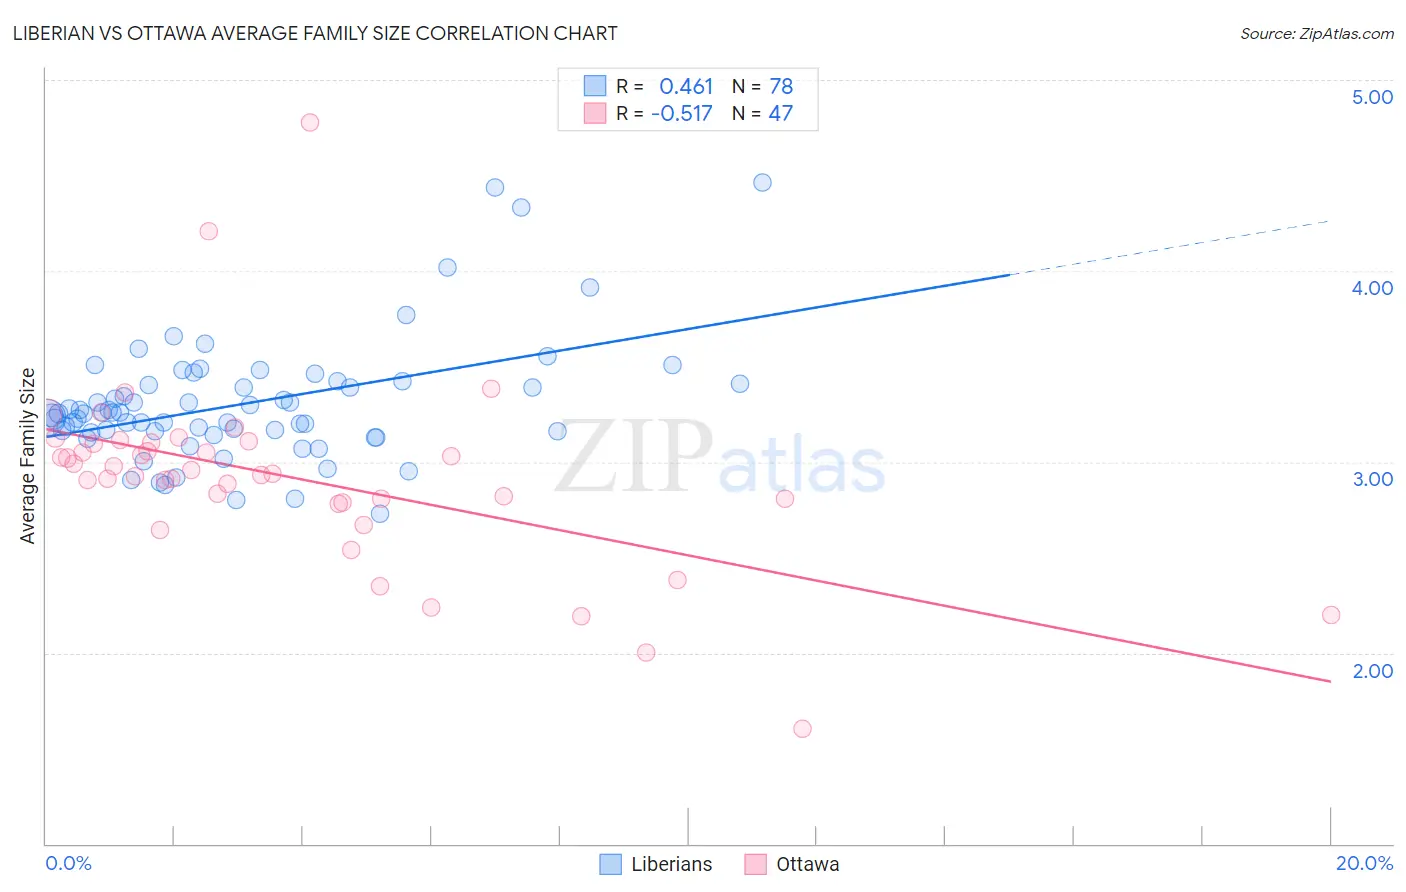
Liberian vs Ottawa Average Family Size Correlation Chart
The statistical analysis conducted on geographies consisting of 118,032,364 people shows a moderate positive correlation between the proportion of Liberians and average family size in the United States with a correlation coefficient (R) of 0.461 and weighted average of 3.25. Similarly, the statistical analysis conducted on geographies consisting of 49,944,420 people shows a substantial negative correlation between the proportion of Ottawa and average family size in the United States with a correlation coefficient (R) of -0.517 and weighted average of 3.11, a difference of 4.5%.
Average Family Size Correlation Summary
| Measurement | Liberian | Ottawa |
| Minimum | 2.73 | 1.60 |
| Maximum | 4.46 | 4.78 |
| Range | 1.73 | 3.18 |
| Mean | 3.30 | 2.92 |
| Median | 3.25 | 2.94 |
| Interquartile 25% (IQ1) | 3.16 | 2.79 |
| Interquartile 75% (IQ3) | 3.41 | 3.10 |
| Interquartile Range (IQR) | 0.25 | 0.31 |
| Standard Deviation (Sample) | 0.32 | 0.49 |
| Standard Deviation (Population) | 0.32 | 0.49 |
Similar Demographics by Average Family Size
Demographics Similar to Liberians by Average Family Size
In terms of average family size, the demographic groups most similar to Liberians are Immigrants from Ethiopia (3.25, a difference of 0.010%), Subsaharan African (3.25, a difference of 0.010%), Venezuelan (3.25, a difference of 0.010%), Bhutanese (3.25, a difference of 0.010%), and Cuban (3.25, a difference of 0.020%).
| Demographics | Rating | Rank | Average Family Size |
| Panamanians | 84.2 /100 | #135 | Excellent 3.25 |
| Comanche | 82.8 /100 | #136 | Excellent 3.25 |
| Immigrants | Middle Africa | 82.4 /100 | #137 | Excellent 3.25 |
| Cubans | 81.8 /100 | #138 | Excellent 3.25 |
| Immigrants | Ethiopia | 81.6 /100 | #139 | Excellent 3.25 |
| Sub-Saharan Africans | 81.6 /100 | #140 | Excellent 3.25 |
| Venezuelans | 81.4 /100 | #141 | Excellent 3.25 |
| Liberians | 81.2 /100 | #142 | Excellent 3.25 |
| Bhutanese | 81.0 /100 | #143 | Excellent 3.25 |
| Tsimshian | 80.2 /100 | #144 | Excellent 3.25 |
| Armenians | 78.2 /100 | #145 | Good 3.25 |
| Immigrants | Africa | 77.9 /100 | #146 | Good 3.25 |
| Immigrants | Jordan | 75.7 /100 | #147 | Good 3.24 |
| Blackfeet | 75.0 /100 | #148 | Good 3.24 |
| Assyrians/Chaldeans/Syriacs | 73.8 /100 | #149 | Good 3.24 |
Demographics Similar to Ottawa by Average Family Size
In terms of average family size, the demographic groups most similar to Ottawa are Dutch (3.11, a difference of 0.010%), Czech (3.11, a difference of 0.010%), English (3.11, a difference of 0.050%), Belgian (3.11, a difference of 0.070%), and Celtic (3.11, a difference of 0.090%).
| Demographics | Rating | Rank | Average Family Size |
| Welsh | 0.1 /100 | #319 | Tragic 3.12 |
| Immigrants | North America | 0.0 /100 | #320 | Tragic 3.12 |
| Immigrants | Austria | 0.0 /100 | #321 | Tragic 3.12 |
| Immigrants | Canada | 0.0 /100 | #322 | Tragic 3.12 |
| Soviet Union | 0.0 /100 | #323 | Tragic 3.11 |
| Celtics | 0.0 /100 | #324 | Tragic 3.11 |
| English | 0.0 /100 | #325 | Tragic 3.11 |
| Ottawa | 0.0 /100 | #326 | Tragic 3.11 |
| Dutch | 0.0 /100 | #327 | Tragic 3.11 |
| Czechs | 0.0 /100 | #328 | Tragic 3.11 |
| Belgians | 0.0 /100 | #329 | Tragic 3.11 |
| Latvians | 0.0 /100 | #330 | Tragic 3.11 |
| Scotch-Irish | 0.0 /100 | #331 | Tragic 3.11 |
| Scottish | 0.0 /100 | #332 | Tragic 3.11 |
| Estonians | 0.0 /100 | #333 | Tragic 3.10 |