Yugoslavian vs Immigrants from Northern Europe Average Family Size
COMPARE
Yugoslavian
Immigrants from Northern Europe
Average Family Size
Average Family Size Comparison
Yugoslavians
Immigrants from Northern Europe
3.15
AVERAGE FAMILY SIZE
0.4/ 100
METRIC RATING
282nd/ 347
METRIC RANK
3.13
AVERAGE FAMILY SIZE
0.1/ 100
METRIC RATING
311th/ 347
METRIC RANK
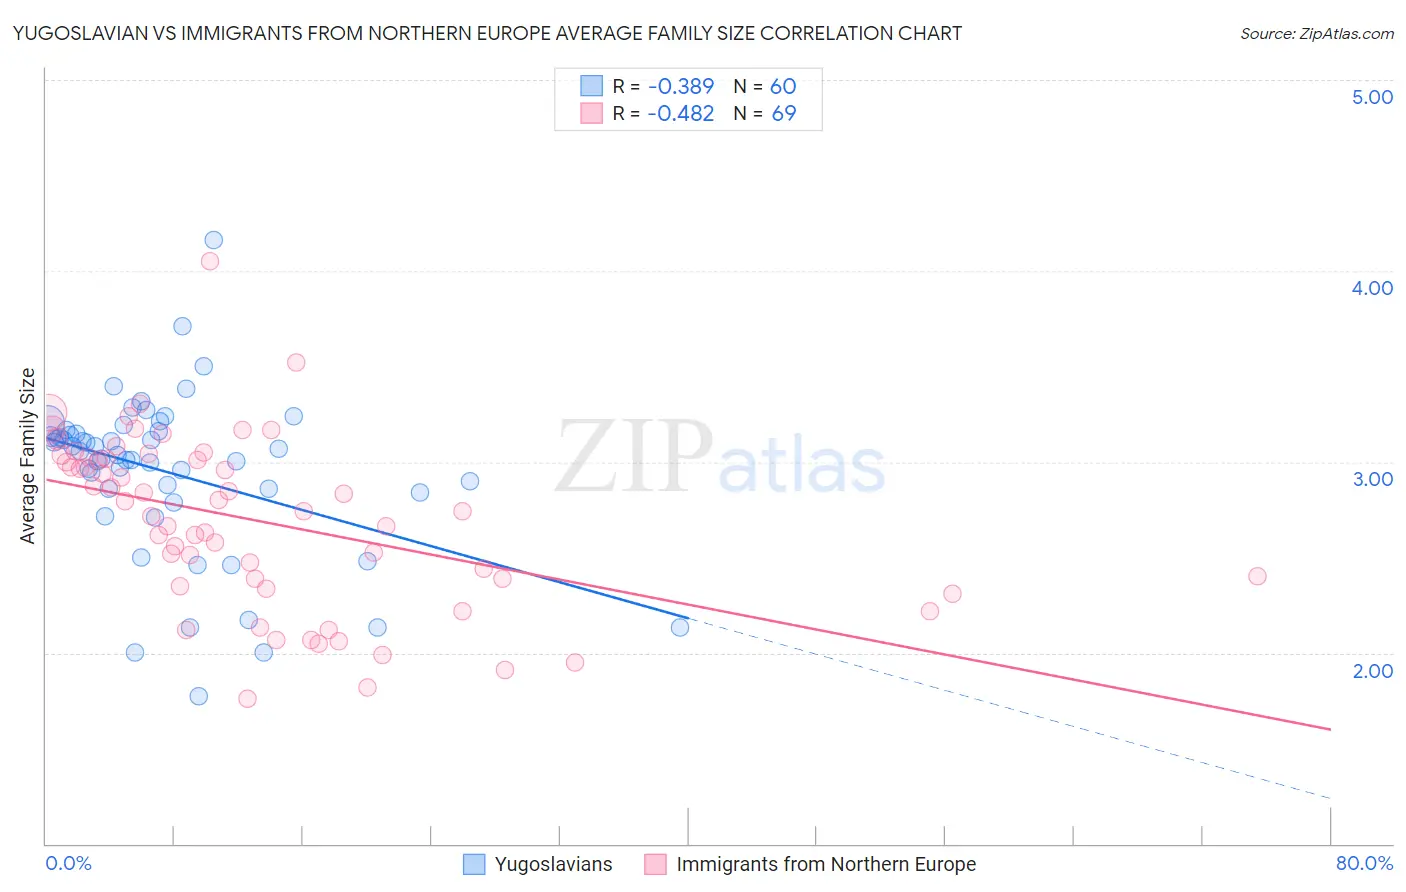
Yugoslavian vs Immigrants from Northern Europe Average Family Size Correlation Chart
The statistical analysis conducted on geographies consisting of 285,640,029 people shows a mild negative correlation between the proportion of Yugoslavians and average family size in the United States with a correlation coefficient (R) of -0.389 and weighted average of 3.15. Similarly, the statistical analysis conducted on geographies consisting of 476,950,566 people shows a moderate negative correlation between the proportion of Immigrants from Northern Europe and average family size in the United States with a correlation coefficient (R) of -0.482 and weighted average of 3.13, a difference of 0.65%.
Average Family Size Correlation Summary
| Measurement | Yugoslavian | Immigrants from Northern Europe |
| Minimum | 1.77 | 1.76 |
| Maximum | 4.16 | 4.05 |
| Range | 2.39 | 2.29 |
| Mean | 2.95 | 2.69 |
| Median | 3.05 | 2.74 |
| Interquartile 25% (IQ1) | 2.85 | 2.37 |
| Interquartile 75% (IQ3) | 3.15 | 3.02 |
| Interquartile Range (IQR) | 0.30 | 0.65 |
| Standard Deviation (Sample) | 0.43 | 0.45 |
| Standard Deviation (Population) | 0.43 | 0.45 |
Similar Demographics by Average Family Size
Demographics Similar to Yugoslavians by Average Family Size
In terms of average family size, the demographic groups most similar to Yugoslavians are Immigrants from Denmark (3.15, a difference of 0.010%), German Russian (3.15, a difference of 0.010%), Immigrants from France (3.15, a difference of 0.030%), Immigrants from England (3.15, a difference of 0.040%), and Immigrants from Europe (3.15, a difference of 0.070%).
| Demographics | Rating | Rank | Average Family Size |
| Cambodians | 0.6 /100 | #275 | Tragic 3.15 |
| Immigrants | Bosnia and Herzegovina | 0.5 /100 | #276 | Tragic 3.15 |
| Swiss | 0.5 /100 | #277 | Tragic 3.15 |
| Okinawans | 0.5 /100 | #278 | Tragic 3.15 |
| Immigrants | Europe | 0.5 /100 | #279 | Tragic 3.15 |
| Immigrants | England | 0.4 /100 | #280 | Tragic 3.15 |
| Immigrants | Denmark | 0.4 /100 | #281 | Tragic 3.15 |
| Yugoslavians | 0.4 /100 | #282 | Tragic 3.15 |
| German Russians | 0.4 /100 | #283 | Tragic 3.15 |
| Immigrants | France | 0.4 /100 | #284 | Tragic 3.15 |
| Whites/Caucasians | 0.3 /100 | #285 | Tragic 3.14 |
| Immigrants | Netherlands | 0.3 /100 | #286 | Tragic 3.14 |
| Greeks | 0.3 /100 | #287 | Tragic 3.14 |
| Immigrants | Czechoslovakia | 0.3 /100 | #288 | Tragic 3.14 |
| Immigrants | Norway | 0.3 /100 | #289 | Tragic 3.14 |
Demographics Similar to Immigrants from Northern Europe by Average Family Size
In terms of average family size, the demographic groups most similar to Immigrants from Northern Europe are Immigrants from Australia (3.13, a difference of 0.020%), Bulgarian (3.13, a difference of 0.030%), Czechoslovakian (3.13, a difference of 0.040%), Northern European (3.13, a difference of 0.060%), and Slavic (3.13, a difference of 0.070%).
| Demographics | Rating | Rank | Average Family Size |
| Immigrants | Switzerland | 0.2 /100 | #304 | Tragic 3.13 |
| Australians | 0.1 /100 | #305 | Tragic 3.13 |
| Immigrants | Ireland | 0.1 /100 | #306 | Tragic 3.13 |
| Immigrants | Serbia | 0.1 /100 | #307 | Tragic 3.13 |
| Slavs | 0.1 /100 | #308 | Tragic 3.13 |
| Northern Europeans | 0.1 /100 | #309 | Tragic 3.13 |
| Czechoslovakians | 0.1 /100 | #310 | Tragic 3.13 |
| Immigrants | Northern Europe | 0.1 /100 | #311 | Tragic 3.13 |
| Immigrants | Australia | 0.1 /100 | #312 | Tragic 3.13 |
| Bulgarians | 0.1 /100 | #313 | Tragic 3.13 |
| Russians | 0.1 /100 | #314 | Tragic 3.12 |
| Immigrants | Scotland | 0.1 /100 | #315 | Tragic 3.12 |
| Serbians | 0.1 /100 | #316 | Tragic 3.12 |
| Italians | 0.1 /100 | #317 | Tragic 3.12 |
| Eastern Europeans | 0.1 /100 | #318 | Tragic 3.12 |