Austrian vs Immigrants from Northern Europe Female Unemployment
COMPARE
Austrian
Immigrants from Northern Europe
Female Unemployment
Female Unemployment Comparison
Austrians
Immigrants from Northern Europe
4.9%
FEMALE UNEMPLOYMENT
99.3/ 100
METRIC RATING
45th/ 347
METRIC RANK
4.9%
FEMALE UNEMPLOYMENT
98.0/ 100
METRIC RATING
72nd/ 347
METRIC RANK
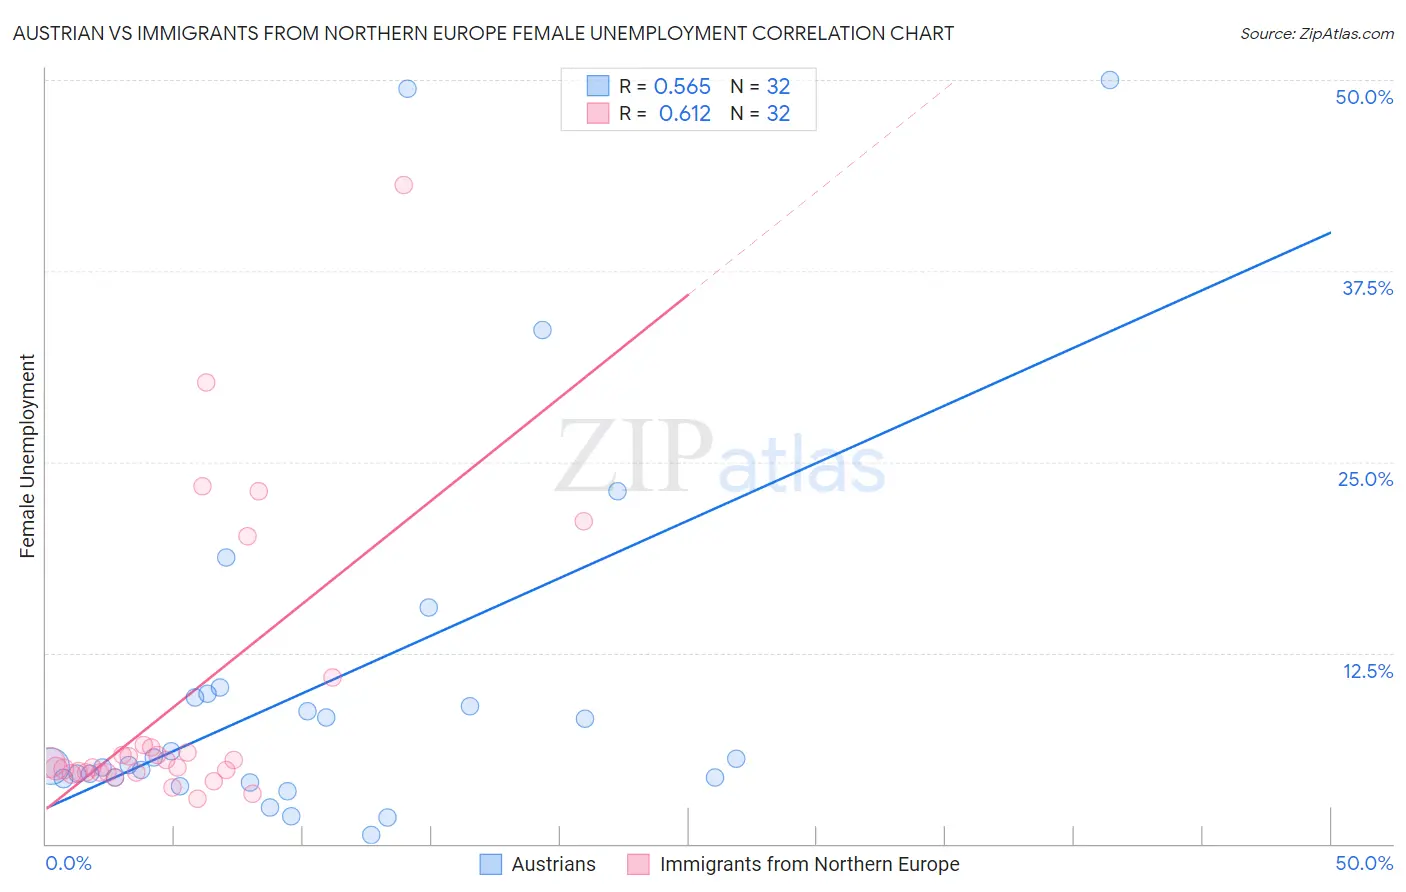
Austrian vs Immigrants from Northern Europe Female Unemployment Correlation Chart
The statistical analysis conducted on geographies consisting of 448,029,522 people shows a substantial positive correlation between the proportion of Austrians and unemploymnet rate among females in the United States with a correlation coefficient (R) of 0.565 and weighted average of 4.9%. Similarly, the statistical analysis conducted on geographies consisting of 473,051,812 people shows a significant positive correlation between the proportion of Immigrants from Northern Europe and unemploymnet rate among females in the United States with a correlation coefficient (R) of 0.612 and weighted average of 4.9%, a difference of 1.8%.
Female Unemployment Correlation Summary
| Measurement | Austrian | Immigrants from Northern Europe |
| Minimum | 0.60% | 3.0% |
| Maximum | 50.0% | 43.1% |
| Range | 49.4% | 40.1% |
| Mean | 10.4% | 9.2% |
| Median | 5.4% | 5.1% |
| Interquartile 25% (IQ1) | 4.3% | 4.7% |
| Interquartile 75% (IQ3) | 9.7% | 6.4% |
| Interquartile Range (IQR) | 5.4% | 1.7% |
| Standard Deviation (Sample) | 12.3% | 9.4% |
| Standard Deviation (Population) | 12.1% | 9.2% |
Similar Demographics by Female Unemployment
Demographics Similar to Austrians by Female Unemployment
In terms of female unemployment, the demographic groups most similar to Austrians are Immigrants from Bulgaria (4.9%, a difference of 0.030%), Greek (4.9%, a difference of 0.080%), Okinawan (4.9%, a difference of 0.11%), Eastern European (4.9%, a difference of 0.18%), and Thai (4.9%, a difference of 0.31%).
| Demographics | Rating | Rank | Female Unemployment |
| Northern Europeans | 99.6 /100 | #38 | Exceptional 4.8% |
| Scotch-Irish | 99.6 /100 | #39 | Exceptional 4.8% |
| French | 99.6 /100 | #40 | Exceptional 4.8% |
| Tongans | 99.5 /100 | #41 | Exceptional 4.8% |
| Italians | 99.5 /100 | #42 | Exceptional 4.8% |
| Eastern Europeans | 99.4 /100 | #43 | Exceptional 4.9% |
| Greeks | 99.4 /100 | #44 | Exceptional 4.9% |
| Austrians | 99.3 /100 | #45 | Exceptional 4.9% |
| Immigrants | Bulgaria | 99.3 /100 | #46 | Exceptional 4.9% |
| Okinawans | 99.3 /100 | #47 | Exceptional 4.9% |
| Thais | 99.2 /100 | #48 | Exceptional 4.9% |
| Australians | 99.2 /100 | #49 | Exceptional 4.9% |
| Immigrants | Cuba | 99.1 /100 | #50 | Exceptional 4.9% |
| Cambodians | 99.1 /100 | #51 | Exceptional 4.9% |
| Slavs | 99.1 /100 | #52 | Exceptional 4.9% |
Demographics Similar to Immigrants from Northern Europe by Female Unemployment
In terms of female unemployment, the demographic groups most similar to Immigrants from Northern Europe are Russian (5.0%, a difference of 0.030%), Immigrants from Bolivia (5.0%, a difference of 0.040%), Immigrants from Singapore (5.0%, a difference of 0.060%), German Russian (4.9%, a difference of 0.070%), and Immigrants from Venezuela (5.0%, a difference of 0.070%).
| Demographics | Rating | Rank | Female Unemployment |
| Immigrants | North America | 98.3 /100 | #65 | Exceptional 4.9% |
| Hungarians | 98.3 /100 | #66 | Exceptional 4.9% |
| Cubans | 98.3 /100 | #67 | Exceptional 4.9% |
| Tlingit-Haida | 98.3 /100 | #68 | Exceptional 4.9% |
| Immigrants | Ireland | 98.2 /100 | #69 | Exceptional 4.9% |
| Osage | 98.2 /100 | #70 | Exceptional 4.9% |
| German Russians | 98.1 /100 | #71 | Exceptional 4.9% |
| Immigrants | Northern Europe | 98.0 /100 | #72 | Exceptional 4.9% |
| Russians | 98.0 /100 | #73 | Exceptional 5.0% |
| Immigrants | Bolivia | 98.0 /100 | #74 | Exceptional 5.0% |
| Immigrants | Singapore | 98.0 /100 | #75 | Exceptional 5.0% |
| Immigrants | Venezuela | 97.9 /100 | #76 | Exceptional 5.0% |
| Mongolians | 97.8 /100 | #77 | Exceptional 5.0% |
| Immigrants | Netherlands | 97.8 /100 | #78 | Exceptional 5.0% |
| Turks | 97.6 /100 | #79 | Exceptional 5.0% |