Carpatho Rusyn vs Immigrants from Kenya Family Households
COMPARE
Carpatho Rusyn
Immigrants from Kenya
Family Households
Family Households Comparison
Carpatho Rusyns
Immigrants from Kenya
61.1%
FAMILY HOUSEHOLDS
0.0/ 100
METRIC RATING
335th/ 347
METRIC RANK
62.3%
FAMILY HOUSEHOLDS
0.0/ 100
METRIC RATING
302nd/ 347
METRIC RANK
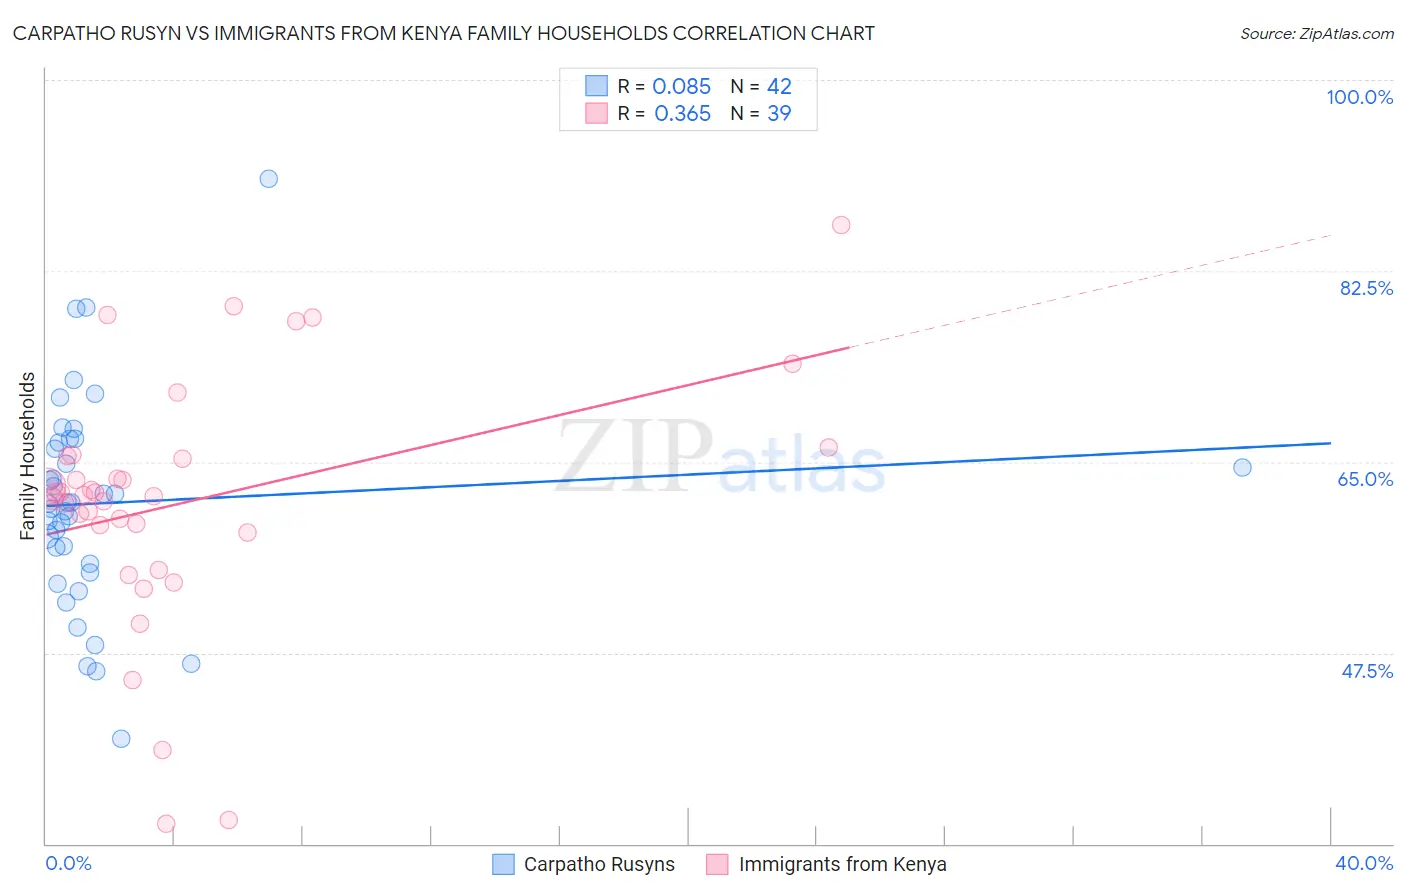
Carpatho Rusyn vs Immigrants from Kenya Family Households Correlation Chart
The statistical analysis conducted on geographies consisting of 58,871,690 people shows a slight positive correlation between the proportion of Carpatho Rusyns and percentage of family households in the United States with a correlation coefficient (R) of 0.085 and weighted average of 61.1%. Similarly, the statistical analysis conducted on geographies consisting of 217,999,239 people shows a mild positive correlation between the proportion of Immigrants from Kenya and percentage of family households in the United States with a correlation coefficient (R) of 0.365 and weighted average of 62.3%, a difference of 2.1%.
Family Households Correlation Summary
| Measurement | Carpatho Rusyn | Immigrants from Kenya |
| Minimum | 39.6% | 31.8% |
| Maximum | 91.0% | 86.7% |
| Range | 51.3% | 54.9% |
| Mean | 61.2% | 61.3% |
| Median | 61.2% | 62.0% |
| Interquartile 25% (IQ1) | 55.7% | 58.5% |
| Interquartile 75% (IQ3) | 66.8% | 65.5% |
| Interquartile Range (IQR) | 11.1% | 7.0% |
| Standard Deviation (Sample) | 9.7% | 11.5% |
| Standard Deviation (Population) | 9.6% | 11.4% |
Similar Demographics by Family Households
Demographics Similar to Carpatho Rusyns by Family Households
In terms of family households, the demographic groups most similar to Carpatho Rusyns are Immigrants from Eastern Africa (61.1%, a difference of 0.12%), Immigrants from Ethiopia (61.2%, a difference of 0.20%), Ethiopian (61.2%, a difference of 0.28%), German Russian (60.9%, a difference of 0.28%), and Soviet Union (60.9%, a difference of 0.28%).
| Demographics | Rating | Rank | Family Households |
| Kiowa | 0.0 /100 | #328 | Tragic 61.4% |
| Cambodians | 0.0 /100 | #329 | Tragic 61.4% |
| Immigrants | Australia | 0.0 /100 | #330 | Tragic 61.3% |
| Immigrants | France | 0.0 /100 | #331 | Tragic 61.3% |
| Ethiopians | 0.0 /100 | #332 | Tragic 61.2% |
| Immigrants | Ethiopia | 0.0 /100 | #333 | Tragic 61.2% |
| Immigrants | Eastern Africa | 0.0 /100 | #334 | Tragic 61.1% |
| Carpatho Rusyns | 0.0 /100 | #335 | Tragic 61.1% |
| German Russians | 0.0 /100 | #336 | Tragic 60.9% |
| Soviet Union | 0.0 /100 | #337 | Tragic 60.9% |
| Immigrants | Eritrea | 0.0 /100 | #338 | Tragic 60.8% |
| Immigrants | Saudi Arabia | 0.0 /100 | #339 | Tragic 60.7% |
| Immigrants | Sudan | 0.0 /100 | #340 | Tragic 60.2% |
| Immigrants | Senegal | 0.0 /100 | #341 | Tragic 60.1% |
| Sudanese | 0.0 /100 | #342 | Tragic 60.0% |
Demographics Similar to Immigrants from Kenya by Family Households
In terms of family households, the demographic groups most similar to Immigrants from Kenya are Immigrants from Albania (62.4%, a difference of 0.040%), Immigrants from Africa (62.4%, a difference of 0.060%), Cree (62.3%, a difference of 0.060%), Immigrants from Kuwait (62.4%, a difference of 0.070%), and Immigrants from Spain (62.4%, a difference of 0.13%).
| Demographics | Rating | Rank | Family Households |
| Okinawans | 0.0 /100 | #295 | Tragic 62.5% |
| Slovenes | 0.0 /100 | #296 | Tragic 62.4% |
| French American Indians | 0.0 /100 | #297 | Tragic 62.4% |
| Immigrants | Spain | 0.0 /100 | #298 | Tragic 62.4% |
| Immigrants | Kuwait | 0.0 /100 | #299 | Tragic 62.4% |
| Immigrants | Africa | 0.0 /100 | #300 | Tragic 62.4% |
| Immigrants | Albania | 0.0 /100 | #301 | Tragic 62.4% |
| Immigrants | Kenya | 0.0 /100 | #302 | Tragic 62.3% |
| Cree | 0.0 /100 | #303 | Tragic 62.3% |
| Iroquois | 0.0 /100 | #304 | Tragic 62.2% |
| Bermudans | 0.0 /100 | #305 | Tragic 62.2% |
| Africans | 0.0 /100 | #306 | Tragic 62.1% |
| Immigrants | Norway | 0.0 /100 | #307 | Tragic 62.1% |
| Chippewa | 0.0 /100 | #308 | Tragic 62.1% |
| Sub-Saharan Africans | 0.0 /100 | #309 | Tragic 62.1% |