Australian vs Immigrants from Sudan Single Mother Households
COMPARE
Australian
Immigrants from Sudan
Single Mother Households
Single Mother Households Comparison
Australians
Immigrants from Sudan
5.6%
SINGLE MOTHER HOUSEHOLDS
98.7/ 100
METRIC RATING
61st/ 347
METRIC RANK
6.9%
SINGLE MOTHER HOUSEHOLDS
3.5/ 100
METRIC RATING
224th/ 347
METRIC RANK
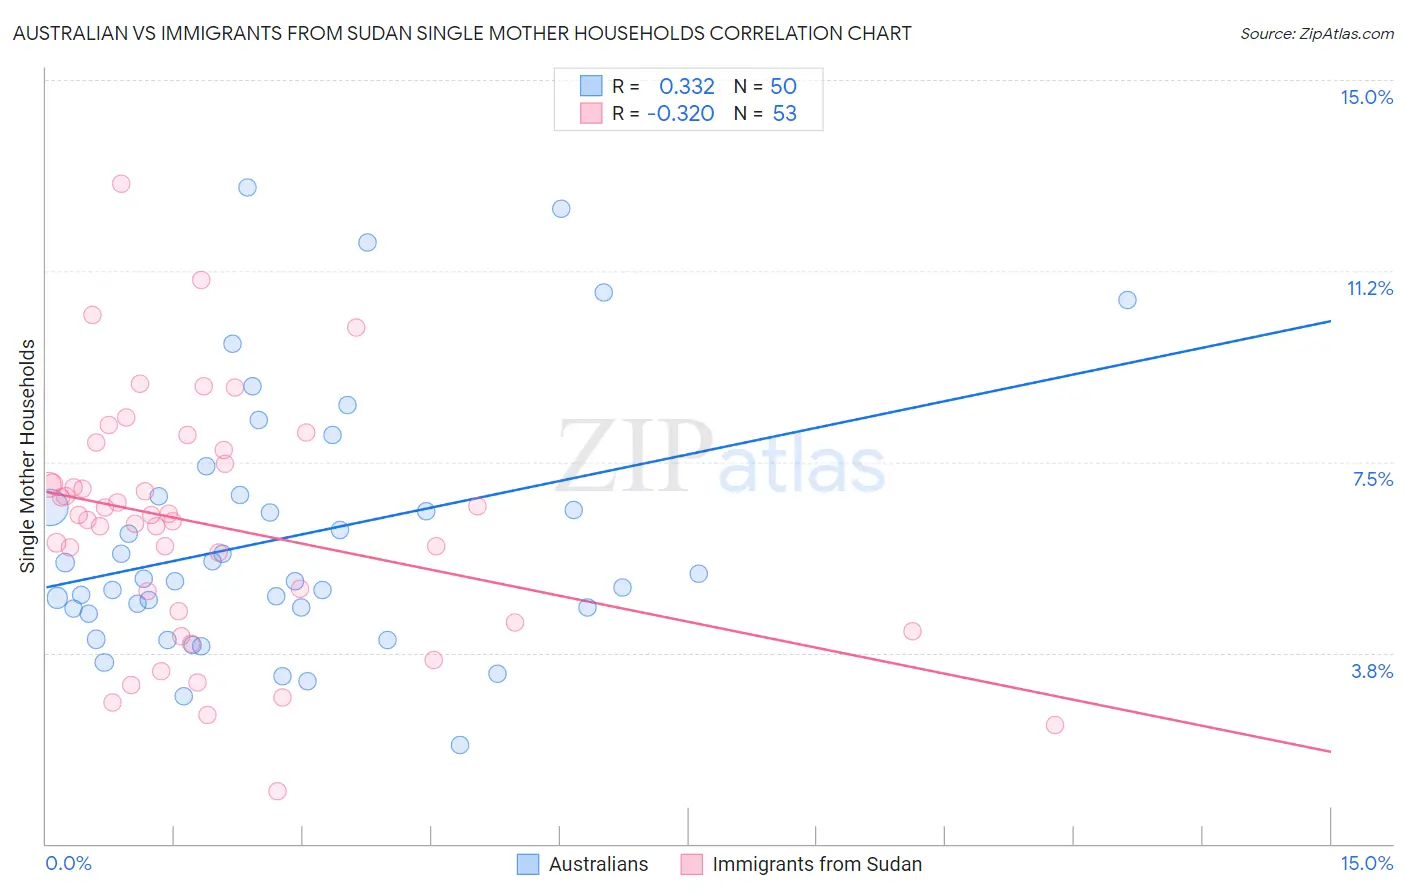
Australian vs Immigrants from Sudan Single Mother Households Correlation Chart
The statistical analysis conducted on geographies consisting of 223,630,517 people shows a mild positive correlation between the proportion of Australians and percentage of single mother households in the United States with a correlation coefficient (R) of 0.332 and weighted average of 5.6%. Similarly, the statistical analysis conducted on geographies consisting of 118,904,005 people shows a mild negative correlation between the proportion of Immigrants from Sudan and percentage of single mother households in the United States with a correlation coefficient (R) of -0.320 and weighted average of 6.9%, a difference of 23.6%.
Single Mother Households Correlation Summary
| Measurement | Australian | Immigrants from Sudan |
| Minimum | 1.9% | 1.0% |
| Maximum | 12.9% | 13.0% |
| Range | 11.0% | 11.9% |
| Mean | 6.0% | 6.3% |
| Median | 5.2% | 6.5% |
| Interquartile 25% (IQ1) | 4.6% | 4.5% |
| Interquartile 75% (IQ3) | 6.8% | 7.6% |
| Interquartile Range (IQR) | 2.2% | 3.1% |
| Standard Deviation (Sample) | 2.5% | 2.4% |
| Standard Deviation (Population) | 2.5% | 2.3% |
Similar Demographics by Single Mother Households
Demographics Similar to Australians by Single Mother Households
In terms of single mother households, the demographic groups most similar to Australians are Polish (5.6%, a difference of 0.010%), Immigrants from Norway (5.6%, a difference of 0.070%), Immigrants from North Macedonia (5.6%, a difference of 0.080%), Immigrants from France (5.6%, a difference of 0.12%), and Greek (5.6%, a difference of 0.16%).
| Demographics | Rating | Rank | Single Mother Households |
| Immigrants | Lebanon | 99.1 /100 | #54 | Exceptional 5.5% |
| Immigrants | Denmark | 99.1 /100 | #55 | Exceptional 5.5% |
| Immigrants | Romania | 99.0 /100 | #56 | Exceptional 5.5% |
| Immigrants | Europe | 99.0 /100 | #57 | Exceptional 5.5% |
| Danes | 98.9 /100 | #58 | Exceptional 5.5% |
| Luxembourgers | 98.7 /100 | #59 | Exceptional 5.6% |
| Immigrants | Norway | 98.7 /100 | #60 | Exceptional 5.6% |
| Australians | 98.7 /100 | #61 | Exceptional 5.6% |
| Poles | 98.6 /100 | #62 | Exceptional 5.6% |
| Immigrants | North Macedonia | 98.6 /100 | #63 | Exceptional 5.6% |
| Immigrants | France | 98.6 /100 | #64 | Exceptional 5.6% |
| Greeks | 98.6 /100 | #65 | Exceptional 5.6% |
| Immigrants | Canada | 98.5 /100 | #66 | Exceptional 5.6% |
| Italians | 98.5 /100 | #67 | Exceptional 5.6% |
| Immigrants | Bulgaria | 98.5 /100 | #68 | Exceptional 5.6% |
Demographics Similar to Immigrants from Sudan by Single Mother Households
In terms of single mother households, the demographic groups most similar to Immigrants from Sudan are Immigrants from Micronesia (6.9%, a difference of 0.12%), Immigrants from Bangladesh (6.9%, a difference of 0.17%), French American Indian (6.9%, a difference of 0.19%), Sudanese (6.9%, a difference of 0.27%), and Immigrants from Thailand (6.9%, a difference of 0.39%).
| Demographics | Rating | Rank | Single Mother Households |
| Aleuts | 4.8 /100 | #217 | Tragic 6.8% |
| Immigrants | Eastern Africa | 4.4 /100 | #218 | Tragic 6.8% |
| Immigrants | Immigrants | 4.3 /100 | #219 | Tragic 6.8% |
| Immigrants | Thailand | 4.0 /100 | #220 | Tragic 6.9% |
| French American Indians | 3.7 /100 | #221 | Tragic 6.9% |
| Immigrants | Bangladesh | 3.7 /100 | #222 | Tragic 6.9% |
| Immigrants | Micronesia | 3.6 /100 | #223 | Tragic 6.9% |
| Immigrants | Sudan | 3.5 /100 | #224 | Tragic 6.9% |
| Sudanese | 3.1 /100 | #225 | Tragic 6.9% |
| Paiute | 2.4 /100 | #226 | Tragic 7.0% |
| Kenyans | 2.3 /100 | #227 | Tragic 7.0% |
| Iroquois | 2.2 /100 | #228 | Tragic 7.0% |
| Immigrants | Kenya | 2.1 /100 | #229 | Tragic 7.0% |
| Creek | 1.6 /100 | #230 | Tragic 7.0% |
| Spanish Americans | 1.6 /100 | #231 | Tragic 7.0% |