Northern European vs Immigrants from Sudan Single Mother Households
COMPARE
Northern European
Immigrants from Sudan
Single Mother Households
Single Mother Households Comparison
Northern Europeans
Immigrants from Sudan
5.8%
SINGLE MOTHER HOUSEHOLDS
96.2/ 100
METRIC RATING
104th/ 347
METRIC RANK
6.9%
SINGLE MOTHER HOUSEHOLDS
3.5/ 100
METRIC RATING
224th/ 347
METRIC RANK
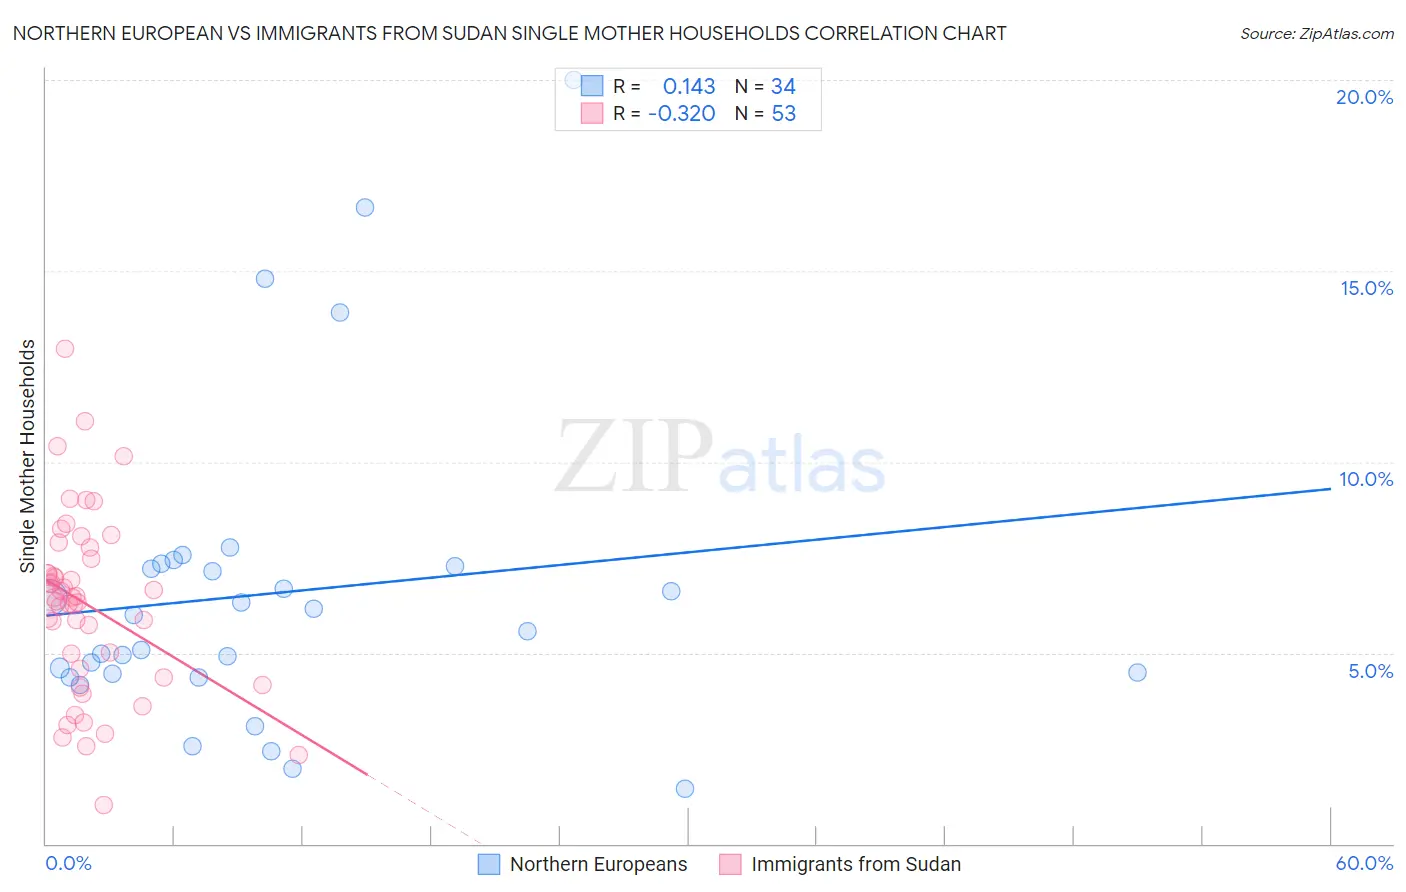
Northern European vs Immigrants from Sudan Single Mother Households Correlation Chart
The statistical analysis conducted on geographies consisting of 404,583,637 people shows a poor positive correlation between the proportion of Northern Europeans and percentage of single mother households in the United States with a correlation coefficient (R) of 0.143 and weighted average of 5.8%. Similarly, the statistical analysis conducted on geographies consisting of 118,904,005 people shows a mild negative correlation between the proportion of Immigrants from Sudan and percentage of single mother households in the United States with a correlation coefficient (R) of -0.320 and weighted average of 6.9%, a difference of 19.7%.
Single Mother Households Correlation Summary
| Measurement | Northern European | Immigrants from Sudan |
| Minimum | 1.5% | 1.0% |
| Maximum | 20.0% | 13.0% |
| Range | 18.5% | 11.9% |
| Mean | 6.6% | 6.3% |
| Median | 5.8% | 6.5% |
| Interquartile 25% (IQ1) | 4.5% | 4.5% |
| Interquartile 75% (IQ3) | 7.3% | 7.6% |
| Interquartile Range (IQR) | 2.8% | 3.1% |
| Standard Deviation (Sample) | 4.1% | 2.4% |
| Standard Deviation (Population) | 4.0% | 2.3% |
Similar Demographics by Single Mother Households
Demographics Similar to Northern Europeans by Single Mother Households
In terms of single mother households, the demographic groups most similar to Northern Europeans are Scottish (5.8%, a difference of 0.010%), English (5.8%, a difference of 0.020%), German (5.8%, a difference of 0.030%), Scandinavian (5.8%, a difference of 0.060%), and Immigrants from Poland (5.8%, a difference of 0.070%).
| Demographics | Rating | Rank | Single Mother Households |
| Tlingit-Haida | 96.4 /100 | #97 | Exceptional 5.7% |
| Immigrants | South Africa | 96.3 /100 | #98 | Exceptional 5.7% |
| Immigrants | Poland | 96.3 /100 | #99 | Exceptional 5.8% |
| Scandinavians | 96.2 /100 | #100 | Exceptional 5.8% |
| Germans | 96.2 /100 | #101 | Exceptional 5.8% |
| English | 96.2 /100 | #102 | Exceptional 5.8% |
| Scottish | 96.2 /100 | #103 | Exceptional 5.8% |
| Northern Europeans | 96.2 /100 | #104 | Exceptional 5.8% |
| Taiwanese | 96.1 /100 | #105 | Exceptional 5.8% |
| Immigrants | Ukraine | 95.9 /100 | #106 | Exceptional 5.8% |
| Paraguayans | 95.8 /100 | #107 | Exceptional 5.8% |
| Immigrants | Italy | 95.8 /100 | #108 | Exceptional 5.8% |
| Immigrants | Western Europe | 95.7 /100 | #109 | Exceptional 5.8% |
| British | 95.5 /100 | #110 | Exceptional 5.8% |
| Immigrants | England | 95.5 /100 | #111 | Exceptional 5.8% |
Demographics Similar to Immigrants from Sudan by Single Mother Households
In terms of single mother households, the demographic groups most similar to Immigrants from Sudan are Immigrants from Micronesia (6.9%, a difference of 0.12%), Immigrants from Bangladesh (6.9%, a difference of 0.17%), French American Indian (6.9%, a difference of 0.19%), Sudanese (6.9%, a difference of 0.27%), and Immigrants from Thailand (6.9%, a difference of 0.39%).
| Demographics | Rating | Rank | Single Mother Households |
| Aleuts | 4.8 /100 | #217 | Tragic 6.8% |
| Immigrants | Eastern Africa | 4.4 /100 | #218 | Tragic 6.8% |
| Immigrants | Immigrants | 4.3 /100 | #219 | Tragic 6.8% |
| Immigrants | Thailand | 4.0 /100 | #220 | Tragic 6.9% |
| French American Indians | 3.7 /100 | #221 | Tragic 6.9% |
| Immigrants | Bangladesh | 3.7 /100 | #222 | Tragic 6.9% |
| Immigrants | Micronesia | 3.6 /100 | #223 | Tragic 6.9% |
| Immigrants | Sudan | 3.5 /100 | #224 | Tragic 6.9% |
| Sudanese | 3.1 /100 | #225 | Tragic 6.9% |
| Paiute | 2.4 /100 | #226 | Tragic 7.0% |
| Kenyans | 2.3 /100 | #227 | Tragic 7.0% |
| Iroquois | 2.2 /100 | #228 | Tragic 7.0% |
| Immigrants | Kenya | 2.1 /100 | #229 | Tragic 7.0% |
| Creek | 1.6 /100 | #230 | Tragic 7.0% |
| Spanish Americans | 1.6 /100 | #231 | Tragic 7.0% |