Australian vs Immigrants from Sweden Single Mother Households
COMPARE
Australian
Immigrants from Sweden
Single Mother Households
Single Mother Households Comparison
Australians
Immigrants from Sweden
5.6%
SINGLE MOTHER HOUSEHOLDS
98.7/ 100
METRIC RATING
61st/ 347
METRIC RANK
5.4%
SINGLE MOTHER HOUSEHOLDS
99.6/ 100
METRIC RATING
39th/ 347
METRIC RANK
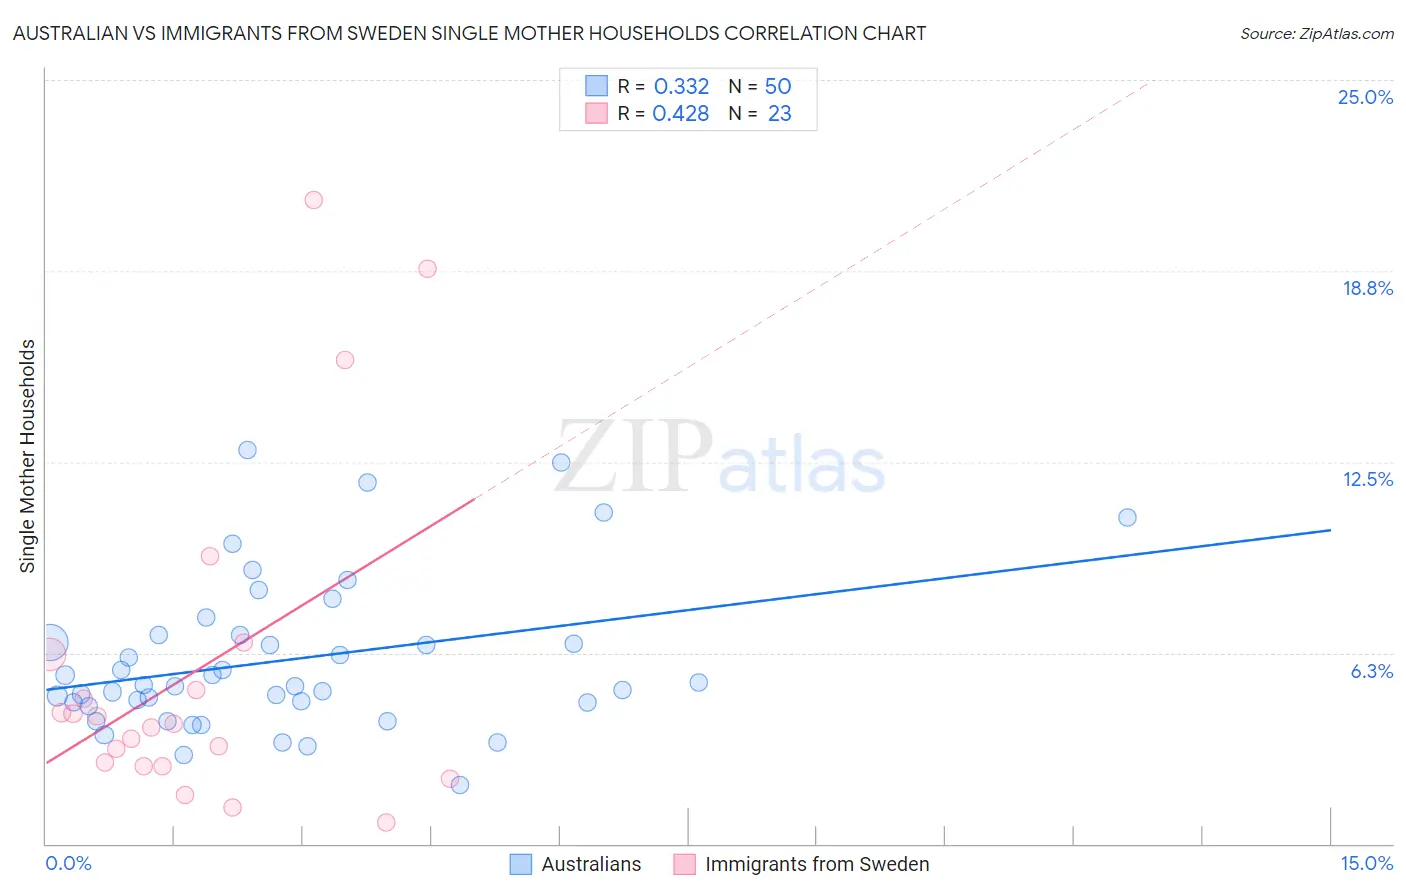
Australian vs Immigrants from Sweden Single Mother Households Correlation Chart
The statistical analysis conducted on geographies consisting of 223,630,517 people shows a mild positive correlation between the proportion of Australians and percentage of single mother households in the United States with a correlation coefficient (R) of 0.332 and weighted average of 5.6%. Similarly, the statistical analysis conducted on geographies consisting of 164,354,075 people shows a moderate positive correlation between the proportion of Immigrants from Sweden and percentage of single mother households in the United States with a correlation coefficient (R) of 0.428 and weighted average of 5.4%, a difference of 3.9%.
Single Mother Households Correlation Summary
| Measurement | Australian | Immigrants from Sweden |
| Minimum | 1.9% | 0.71% |
| Maximum | 12.9% | 21.1% |
| Range | 11.0% | 20.3% |
| Mean | 6.0% | 5.7% |
| Median | 5.2% | 3.9% |
| Interquartile 25% (IQ1) | 4.6% | 2.5% |
| Interquartile 75% (IQ3) | 6.8% | 6.2% |
| Interquartile Range (IQR) | 2.2% | 3.7% |
| Standard Deviation (Sample) | 2.5% | 5.5% |
| Standard Deviation (Population) | 2.5% | 5.4% |
Similar Demographics by Single Mother Households
Demographics Similar to Australians by Single Mother Households
In terms of single mother households, the demographic groups most similar to Australians are Polish (5.6%, a difference of 0.010%), Immigrants from Norway (5.6%, a difference of 0.070%), Immigrants from North Macedonia (5.6%, a difference of 0.080%), Immigrants from France (5.6%, a difference of 0.12%), and Greek (5.6%, a difference of 0.16%).
| Demographics | Rating | Rank | Single Mother Households |
| Immigrants | Lebanon | 99.1 /100 | #54 | Exceptional 5.5% |
| Immigrants | Denmark | 99.1 /100 | #55 | Exceptional 5.5% |
| Immigrants | Romania | 99.0 /100 | #56 | Exceptional 5.5% |
| Immigrants | Europe | 99.0 /100 | #57 | Exceptional 5.5% |
| Danes | 98.9 /100 | #58 | Exceptional 5.5% |
| Luxembourgers | 98.7 /100 | #59 | Exceptional 5.6% |
| Immigrants | Norway | 98.7 /100 | #60 | Exceptional 5.6% |
| Australians | 98.7 /100 | #61 | Exceptional 5.6% |
| Poles | 98.6 /100 | #62 | Exceptional 5.6% |
| Immigrants | North Macedonia | 98.6 /100 | #63 | Exceptional 5.6% |
| Immigrants | France | 98.6 /100 | #64 | Exceptional 5.6% |
| Greeks | 98.6 /100 | #65 | Exceptional 5.6% |
| Immigrants | Canada | 98.5 /100 | #66 | Exceptional 5.6% |
| Italians | 98.5 /100 | #67 | Exceptional 5.6% |
| Immigrants | Bulgaria | 98.5 /100 | #68 | Exceptional 5.6% |
Demographics Similar to Immigrants from Sweden by Single Mother Households
In terms of single mother households, the demographic groups most similar to Immigrants from Sweden are Estonian (5.4%, a difference of 0.11%), Immigrants from Serbia (5.4%, a difference of 0.14%), Immigrants from Greece (5.4%, a difference of 0.53%), Immigrants from Belgium (5.3%, a difference of 0.58%), and Macedonian (5.4%, a difference of 0.61%).
| Demographics | Rating | Rank | Single Mother Households |
| Cambodians | 99.7 /100 | #32 | Exceptional 5.3% |
| Immigrants | Switzerland | 99.7 /100 | #33 | Exceptional 5.3% |
| Bulgarians | 99.7 /100 | #34 | Exceptional 5.3% |
| Immigrants | Northern Europe | 99.7 /100 | #35 | Exceptional 5.3% |
| Immigrants | Czechoslovakia | 99.7 /100 | #36 | Exceptional 5.3% |
| Immigrants | Belgium | 99.7 /100 | #37 | Exceptional 5.3% |
| Immigrants | Serbia | 99.6 /100 | #38 | Exceptional 5.4% |
| Immigrants | Sweden | 99.6 /100 | #39 | Exceptional 5.4% |
| Estonians | 99.6 /100 | #40 | Exceptional 5.4% |
| Immigrants | Greece | 99.5 /100 | #41 | Exceptional 5.4% |
| Macedonians | 99.5 /100 | #42 | Exceptional 5.4% |
| Immigrants | South Central Asia | 99.5 /100 | #43 | Exceptional 5.4% |
| Lithuanians | 99.4 /100 | #44 | Exceptional 5.4% |
| Immigrants | Croatia | 99.4 /100 | #45 | Exceptional 5.4% |
| Croatians | 99.3 /100 | #46 | Exceptional 5.5% |