Australian vs Immigrants from Sudan Bachelor's Degree
COMPARE
Australian
Immigrants from Sudan
Bachelor's Degree
Bachelor's Degree Comparison
Australians
Immigrants from Sudan
44.0%
BACHELOR'S DEGREE
99.9/ 100
METRIC RATING
59th/ 347
METRIC RANK
39.4%
BACHELOR'S DEGREE
84.5/ 100
METRIC RATING
139th/ 347
METRIC RANK
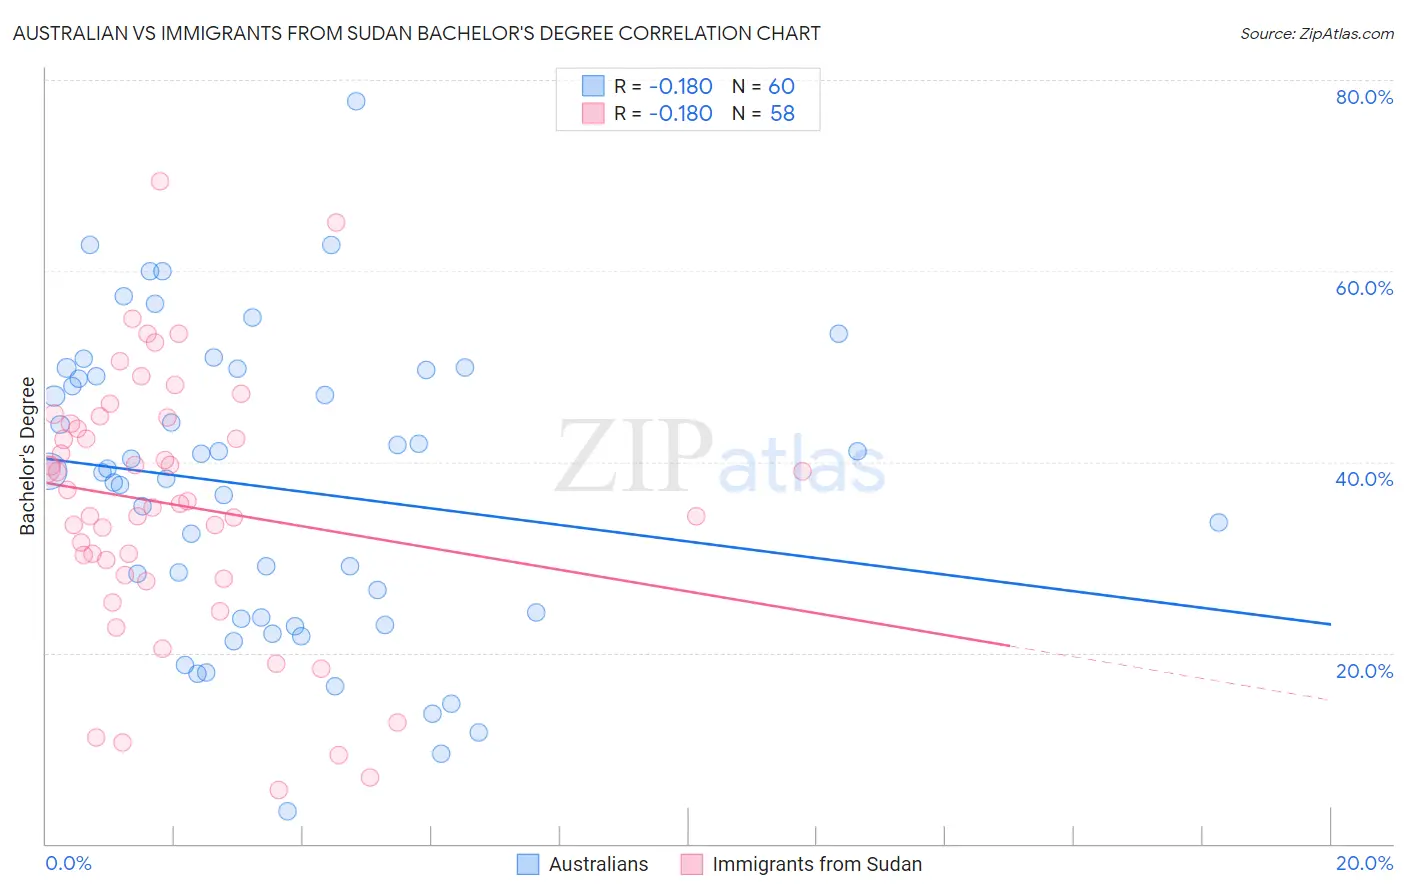
Australian vs Immigrants from Sudan Bachelor's Degree Correlation Chart
The statistical analysis conducted on geographies consisting of 224,140,970 people shows a poor negative correlation between the proportion of Australians and percentage of population with at least bachelor's degree education in the United States with a correlation coefficient (R) of -0.180 and weighted average of 44.0%. Similarly, the statistical analysis conducted on geographies consisting of 118,968,853 people shows a poor negative correlation between the proportion of Immigrants from Sudan and percentage of population with at least bachelor's degree education in the United States with a correlation coefficient (R) of -0.180 and weighted average of 39.4%, a difference of 11.7%.
Bachelor's Degree Correlation Summary
| Measurement | Australian | Immigrants from Sudan |
| Minimum | 3.4% | 5.7% |
| Maximum | 77.7% | 69.4% |
| Range | 74.3% | 63.7% |
| Mean | 37.3% | 35.5% |
| Median | 38.9% | 35.7% |
| Interquartile 25% (IQ1) | 23.7% | 28.1% |
| Interquartile 75% (IQ3) | 49.3% | 44.0% |
| Interquartile Range (IQR) | 25.7% | 15.8% |
| Standard Deviation (Sample) | 15.6% | 13.6% |
| Standard Deviation (Population) | 15.5% | 13.4% |
Similar Demographics by Bachelor's Degree
Demographics Similar to Australians by Bachelor's Degree
In terms of bachelor's degree, the demographic groups most similar to Australians are New Zealander (44.0%, a difference of 0.010%), Immigrants from Czechoslovakia (44.0%, a difference of 0.10%), Paraguayan (44.0%, a difference of 0.16%), Immigrants from Serbia (44.1%, a difference of 0.34%), and Immigrants from Austria (44.2%, a difference of 0.53%).
| Demographics | Rating | Rank | Bachelor's Degree |
| Immigrants | Spain | 99.9 /100 | #52 | Exceptional 44.3% |
| Immigrants | Asia | 99.9 /100 | #53 | Exceptional 44.3% |
| Immigrants | Austria | 99.9 /100 | #54 | Exceptional 44.2% |
| Immigrants | Bolivia | 99.9 /100 | #55 | Exceptional 44.2% |
| Immigrants | Serbia | 99.9 /100 | #56 | Exceptional 44.1% |
| Paraguayans | 99.9 /100 | #57 | Exceptional 44.0% |
| Immigrants | Czechoslovakia | 99.9 /100 | #58 | Exceptional 44.0% |
| Australians | 99.9 /100 | #59 | Exceptional 44.0% |
| New Zealanders | 99.9 /100 | #60 | Exceptional 44.0% |
| South Africans | 99.8 /100 | #61 | Exceptional 43.6% |
| Immigrants | Kazakhstan | 99.8 /100 | #62 | Exceptional 43.4% |
| Immigrants | Europe | 99.8 /100 | #63 | Exceptional 43.4% |
| Argentineans | 99.7 /100 | #64 | Exceptional 43.3% |
| Zimbabweans | 99.7 /100 | #65 | Exceptional 43.3% |
| Immigrants | Netherlands | 99.7 /100 | #66 | Exceptional 43.3% |
Demographics Similar to Immigrants from Sudan by Bachelor's Degree
In terms of bachelor's degree, the demographic groups most similar to Immigrants from Sudan are Immigrants from Armenia (39.4%, a difference of 0.070%), South American Indian (39.3%, a difference of 0.16%), European (39.5%, a difference of 0.20%), Icelander (39.5%, a difference of 0.37%), and Immigrants from North Macedonia (39.2%, a difference of 0.48%).
| Demographics | Rating | Rank | Bachelor's Degree |
| Taiwanese | 91.1 /100 | #132 | Exceptional 40.0% |
| Immigrants | Southern Europe | 91.1 /100 | #133 | Exceptional 40.0% |
| Assyrians/Chaldeans/Syriacs | 89.4 /100 | #134 | Excellent 39.8% |
| Luxembourgers | 89.1 /100 | #135 | Excellent 39.8% |
| Pakistanis | 88.2 /100 | #136 | Excellent 39.7% |
| Icelanders | 86.5 /100 | #137 | Excellent 39.5% |
| Europeans | 85.6 /100 | #138 | Excellent 39.5% |
| Immigrants | Sudan | 84.5 /100 | #139 | Excellent 39.4% |
| Immigrants | Armenia | 84.1 /100 | #140 | Excellent 39.4% |
| South American Indians | 83.6 /100 | #141 | Excellent 39.3% |
| Immigrants | North Macedonia | 81.6 /100 | #142 | Excellent 39.2% |
| Poles | 79.8 /100 | #143 | Good 39.1% |
| Immigrants | Afghanistan | 79.7 /100 | #144 | Good 39.1% |
| Slovenes | 79.5 /100 | #145 | Good 39.1% |
| Swedes | 79.2 /100 | #146 | Good 39.1% |