Australian vs Pakistani Single Mother Households
COMPARE
Australian
Pakistani
Single Mother Households
Single Mother Households Comparison
Australians
Pakistanis
5.6%
SINGLE MOTHER HOUSEHOLDS
98.7/ 100
METRIC RATING
61st/ 347
METRIC RANK
6.1%
SINGLE MOTHER HOUSEHOLDS
79.2/ 100
METRIC RATING
152nd/ 347
METRIC RANK
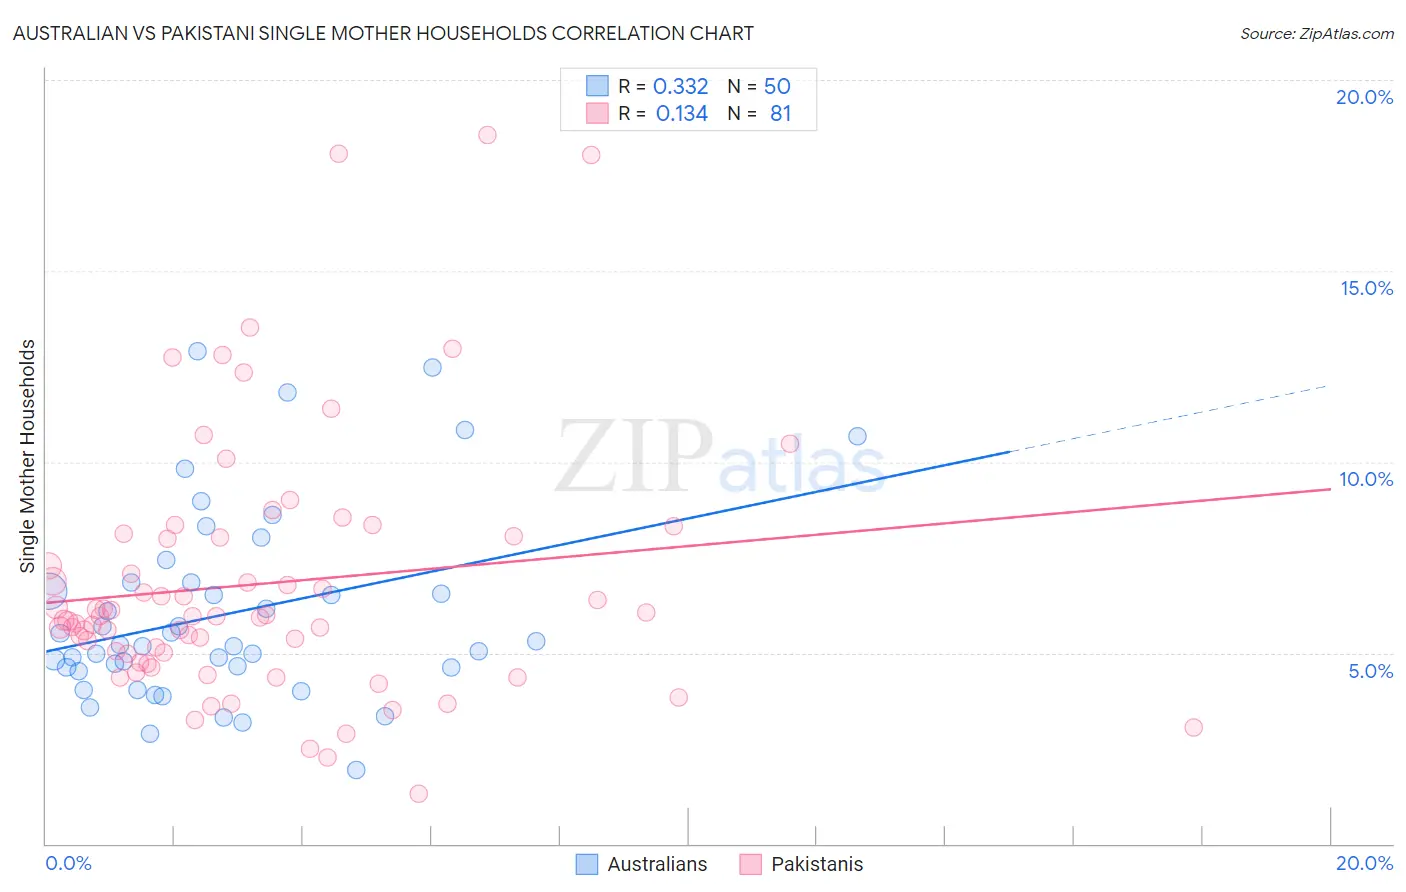
Australian vs Pakistani Single Mother Households Correlation Chart
The statistical analysis conducted on geographies consisting of 223,630,517 people shows a mild positive correlation between the proportion of Australians and percentage of single mother households in the United States with a correlation coefficient (R) of 0.332 and weighted average of 5.6%. Similarly, the statistical analysis conducted on geographies consisting of 334,696,981 people shows a poor positive correlation between the proportion of Pakistanis and percentage of single mother households in the United States with a correlation coefficient (R) of 0.134 and weighted average of 6.1%, a difference of 9.2%.
Single Mother Households Correlation Summary
| Measurement | Australian | Pakistani |
| Minimum | 1.9% | 1.3% |
| Maximum | 12.9% | 18.6% |
| Range | 11.0% | 17.3% |
| Mean | 6.0% | 6.8% |
| Median | 5.2% | 6.0% |
| Interquartile 25% (IQ1) | 4.6% | 4.9% |
| Interquartile 75% (IQ3) | 6.8% | 8.0% |
| Interquartile Range (IQR) | 2.2% | 3.2% |
| Standard Deviation (Sample) | 2.5% | 3.4% |
| Standard Deviation (Population) | 2.5% | 3.4% |
Similar Demographics by Single Mother Households
Demographics Similar to Australians by Single Mother Households
In terms of single mother households, the demographic groups most similar to Australians are Polish (5.6%, a difference of 0.010%), Immigrants from Norway (5.6%, a difference of 0.070%), Immigrants from North Macedonia (5.6%, a difference of 0.080%), Immigrants from France (5.6%, a difference of 0.12%), and Greek (5.6%, a difference of 0.16%).
| Demographics | Rating | Rank | Single Mother Households |
| Immigrants | Lebanon | 99.1 /100 | #54 | Exceptional 5.5% |
| Immigrants | Denmark | 99.1 /100 | #55 | Exceptional 5.5% |
| Immigrants | Romania | 99.0 /100 | #56 | Exceptional 5.5% |
| Immigrants | Europe | 99.0 /100 | #57 | Exceptional 5.5% |
| Danes | 98.9 /100 | #58 | Exceptional 5.5% |
| Luxembourgers | 98.7 /100 | #59 | Exceptional 5.6% |
| Immigrants | Norway | 98.7 /100 | #60 | Exceptional 5.6% |
| Australians | 98.7 /100 | #61 | Exceptional 5.6% |
| Poles | 98.6 /100 | #62 | Exceptional 5.6% |
| Immigrants | North Macedonia | 98.6 /100 | #63 | Exceptional 5.6% |
| Immigrants | France | 98.6 /100 | #64 | Exceptional 5.6% |
| Greeks | 98.6 /100 | #65 | Exceptional 5.6% |
| Immigrants | Canada | 98.5 /100 | #66 | Exceptional 5.6% |
| Italians | 98.5 /100 | #67 | Exceptional 5.6% |
| Immigrants | Bulgaria | 98.5 /100 | #68 | Exceptional 5.6% |
Demographics Similar to Pakistanis by Single Mother Households
In terms of single mother households, the demographic groups most similar to Pakistanis are Immigrants from Brazil (6.1%, a difference of 0.040%), Immigrants from Philippines (6.1%, a difference of 0.11%), Immigrants from Southern Europe (6.1%, a difference of 0.23%), Zimbabwean (6.1%, a difference of 0.28%), and Immigrants from Albania (6.1%, a difference of 0.42%).
| Demographics | Rating | Rank | Single Mother Households |
| Arabs | 84.0 /100 | #145 | Excellent 6.0% |
| French Canadians | 82.6 /100 | #146 | Excellent 6.0% |
| Immigrants | Jordan | 82.3 /100 | #147 | Excellent 6.0% |
| Scotch-Irish | 82.0 /100 | #148 | Excellent 6.0% |
| Immigrants | Albania | 81.5 /100 | #149 | Excellent 6.1% |
| Zimbabweans | 80.7 /100 | #150 | Excellent 6.1% |
| Immigrants | Southern Europe | 80.5 /100 | #151 | Excellent 6.1% |
| Pakistanis | 79.2 /100 | #152 | Good 6.1% |
| Immigrants | Brazil | 78.9 /100 | #153 | Good 6.1% |
| Immigrants | Philippines | 78.5 /100 | #154 | Good 6.1% |
| Whites/Caucasians | 76.5 /100 | #155 | Good 6.1% |
| Native Hawaiians | 75.0 /100 | #156 | Good 6.1% |
| Chileans | 74.2 /100 | #157 | Good 6.1% |
| Celtics | 73.3 /100 | #158 | Good 6.1% |
| Yugoslavians | 73.1 /100 | #159 | Good 6.1% |