Australian vs Finnish Single Mother Households
COMPARE
Australian
Finnish
Single Mother Households
Single Mother Households Comparison
Australians
Finns
5.6%
SINGLE MOTHER HOUSEHOLDS
98.7/ 100
METRIC RATING
61st/ 347
METRIC RANK
5.7%
SINGLE MOTHER HOUSEHOLDS
97.6/ 100
METRIC RATING
86th/ 347
METRIC RANK
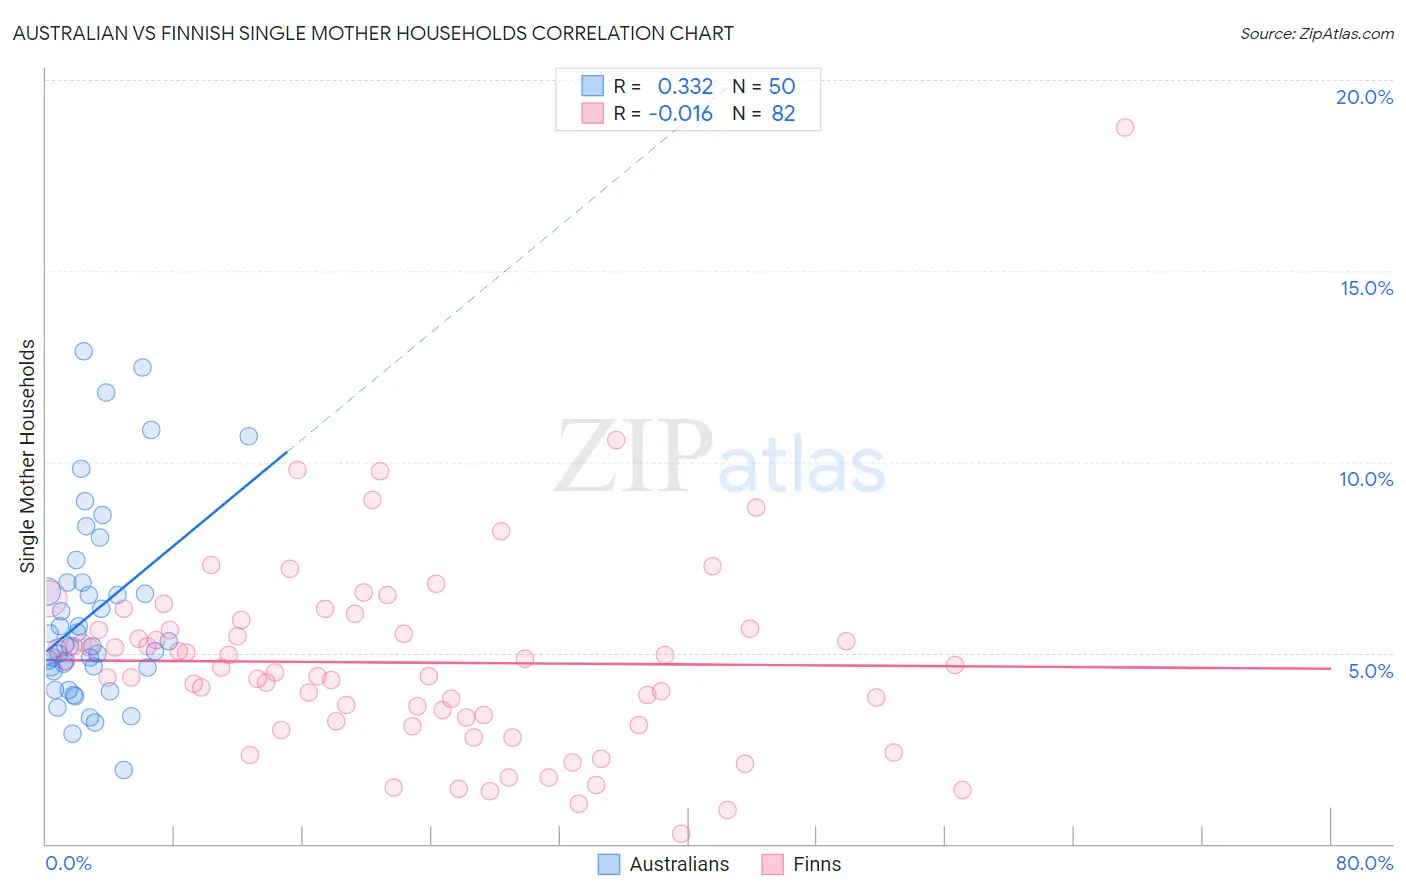
Australian vs Finnish Single Mother Households Correlation Chart
The statistical analysis conducted on geographies consisting of 223,630,517 people shows a mild positive correlation between the proportion of Australians and percentage of single mother households in the United States with a correlation coefficient (R) of 0.332 and weighted average of 5.6%. Similarly, the statistical analysis conducted on geographies consisting of 403,107,301 people shows no correlation between the proportion of Finns and percentage of single mother households in the United States with a correlation coefficient (R) of -0.016 and weighted average of 5.7%, a difference of 1.9%.
Single Mother Households Correlation Summary
| Measurement | Australian | Finnish |
| Minimum | 1.9% | 0.26% |
| Maximum | 12.9% | 18.8% |
| Range | 11.0% | 18.5% |
| Mean | 6.0% | 4.7% |
| Median | 5.2% | 4.5% |
| Interquartile 25% (IQ1) | 4.6% | 3.2% |
| Interquartile 75% (IQ3) | 6.8% | 5.6% |
| Interquartile Range (IQR) | 2.2% | 2.4% |
| Standard Deviation (Sample) | 2.5% | 2.6% |
| Standard Deviation (Population) | 2.5% | 2.6% |
Similar Demographics by Single Mother Households
Demographics Similar to Australians by Single Mother Households
In terms of single mother households, the demographic groups most similar to Australians are Polish (5.6%, a difference of 0.010%), Immigrants from Norway (5.6%, a difference of 0.070%), Immigrants from North Macedonia (5.6%, a difference of 0.080%), Immigrants from France (5.6%, a difference of 0.12%), and Greek (5.6%, a difference of 0.16%).
| Demographics | Rating | Rank | Single Mother Households |
| Immigrants | Lebanon | 99.1 /100 | #54 | Exceptional 5.5% |
| Immigrants | Denmark | 99.1 /100 | #55 | Exceptional 5.5% |
| Immigrants | Romania | 99.0 /100 | #56 | Exceptional 5.5% |
| Immigrants | Europe | 99.0 /100 | #57 | Exceptional 5.5% |
| Danes | 98.9 /100 | #58 | Exceptional 5.5% |
| Luxembourgers | 98.7 /100 | #59 | Exceptional 5.6% |
| Immigrants | Norway | 98.7 /100 | #60 | Exceptional 5.6% |
| Australians | 98.7 /100 | #61 | Exceptional 5.6% |
| Poles | 98.6 /100 | #62 | Exceptional 5.6% |
| Immigrants | North Macedonia | 98.6 /100 | #63 | Exceptional 5.6% |
| Immigrants | France | 98.6 /100 | #64 | Exceptional 5.6% |
| Greeks | 98.6 /100 | #65 | Exceptional 5.6% |
| Immigrants | Canada | 98.5 /100 | #66 | Exceptional 5.6% |
| Italians | 98.5 /100 | #67 | Exceptional 5.6% |
| Immigrants | Bulgaria | 98.5 /100 | #68 | Exceptional 5.6% |
Demographics Similar to Finns by Single Mother Households
In terms of single mother households, the demographic groups most similar to Finns are Hungarian (5.7%, a difference of 0.030%), Immigrants from Turkey (5.7%, a difference of 0.080%), Israeli (5.7%, a difference of 0.15%), Carpatho Rusyn (5.7%, a difference of 0.18%), and Immigrants from Hungary (5.7%, a difference of 0.25%).
| Demographics | Rating | Rank | Single Mother Households |
| Immigrants | Sri Lanka | 98.0 /100 | #79 | Exceptional 5.6% |
| Czechs | 97.9 /100 | #80 | Exceptional 5.6% |
| Immigrants | Moldova | 97.9 /100 | #81 | Exceptional 5.6% |
| Immigrants | Malaysia | 97.8 /100 | #82 | Exceptional 5.7% |
| Immigrants | Hungary | 97.8 /100 | #83 | Exceptional 5.7% |
| Carpatho Rusyns | 97.7 /100 | #84 | Exceptional 5.7% |
| Hungarians | 97.6 /100 | #85 | Exceptional 5.7% |
| Finns | 97.6 /100 | #86 | Exceptional 5.7% |
| Immigrants | Turkey | 97.5 /100 | #87 | Exceptional 5.7% |
| Israelis | 97.4 /100 | #88 | Exceptional 5.7% |
| Ukrainians | 97.2 /100 | #89 | Exceptional 5.7% |
| Immigrants | Indonesia | 97.2 /100 | #90 | Exceptional 5.7% |
| Europeans | 97.0 /100 | #91 | Exceptional 5.7% |
| Immigrants | Western Asia | 96.7 /100 | #92 | Exceptional 5.7% |
| Serbians | 96.7 /100 | #93 | Exceptional 5.7% |