Australian vs Immigrants from Cambodia Single Mother Households
COMPARE
Australian
Immigrants from Cambodia
Single Mother Households
Single Mother Households Comparison
Australians
Immigrants from Cambodia
5.6%
SINGLE MOTHER HOUSEHOLDS
98.7/ 100
METRIC RATING
61st/ 347
METRIC RANK
7.2%
SINGLE MOTHER HOUSEHOLDS
0.5/ 100
METRIC RATING
245th/ 347
METRIC RANK
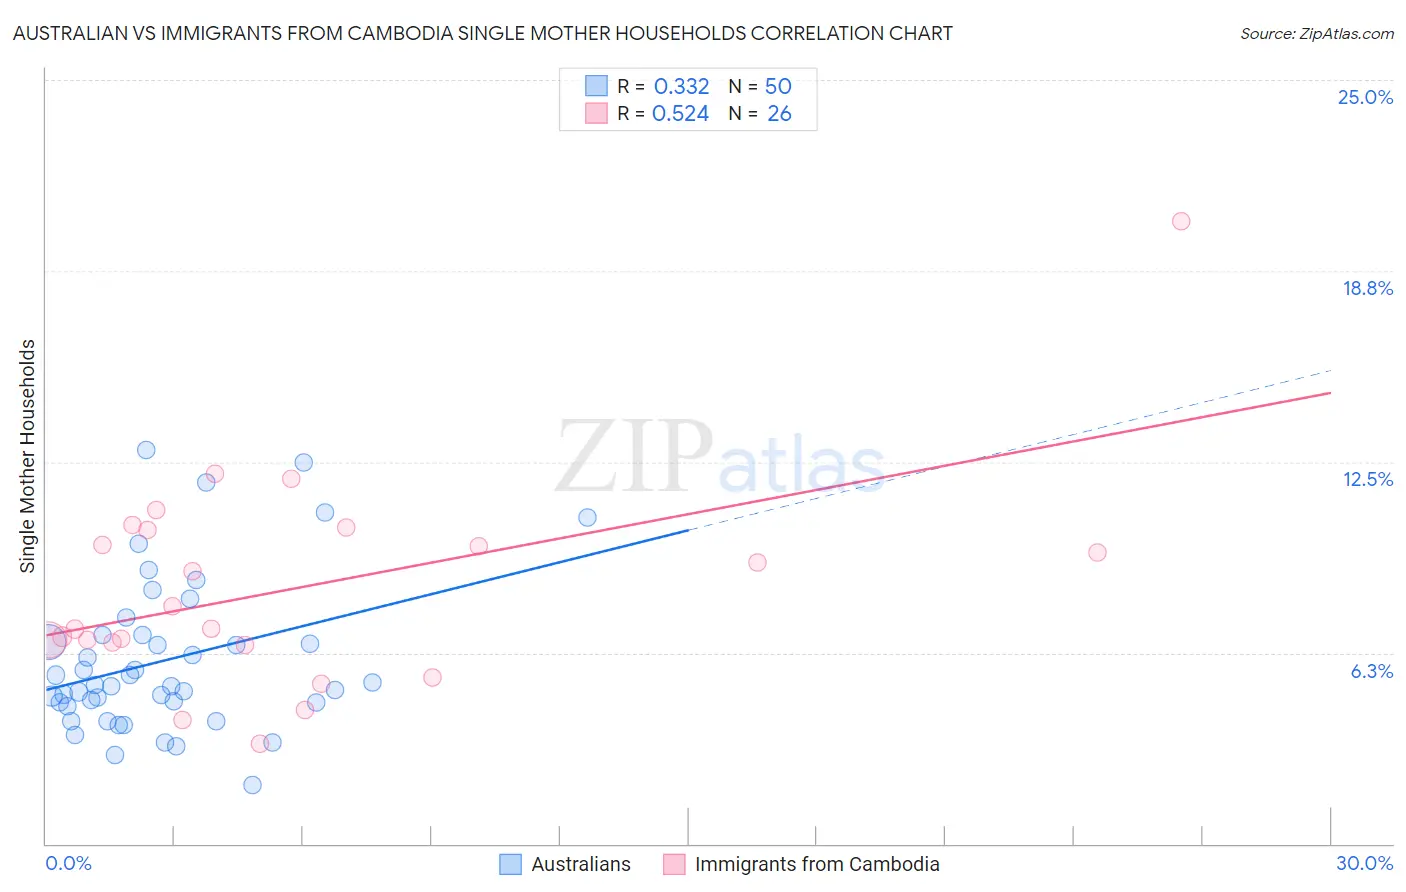
Australian vs Immigrants from Cambodia Single Mother Households Correlation Chart
The statistical analysis conducted on geographies consisting of 223,630,517 people shows a mild positive correlation between the proportion of Australians and percentage of single mother households in the United States with a correlation coefficient (R) of 0.332 and weighted average of 5.6%. Similarly, the statistical analysis conducted on geographies consisting of 205,083,735 people shows a substantial positive correlation between the proportion of Immigrants from Cambodia and percentage of single mother households in the United States with a correlation coefficient (R) of 0.524 and weighted average of 7.2%, a difference of 29.7%.
Single Mother Households Correlation Summary
| Measurement | Australian | Immigrants from Cambodia |
| Minimum | 1.9% | 3.3% |
| Maximum | 12.9% | 20.4% |
| Range | 11.0% | 17.1% |
| Mean | 6.0% | 8.4% |
| Median | 5.2% | 7.4% |
| Interquartile 25% (IQ1) | 4.6% | 6.6% |
| Interquartile 75% (IQ3) | 6.8% | 10.3% |
| Interquartile Range (IQR) | 2.2% | 3.7% |
| Standard Deviation (Sample) | 2.5% | 3.4% |
| Standard Deviation (Population) | 2.5% | 3.4% |
Similar Demographics by Single Mother Households
Demographics Similar to Australians by Single Mother Households
In terms of single mother households, the demographic groups most similar to Australians are Polish (5.6%, a difference of 0.010%), Immigrants from Norway (5.6%, a difference of 0.070%), Immigrants from North Macedonia (5.6%, a difference of 0.080%), Immigrants from France (5.6%, a difference of 0.12%), and Greek (5.6%, a difference of 0.16%).
| Demographics | Rating | Rank | Single Mother Households |
| Immigrants | Lebanon | 99.1 /100 | #54 | Exceptional 5.5% |
| Immigrants | Denmark | 99.1 /100 | #55 | Exceptional 5.5% |
| Immigrants | Romania | 99.0 /100 | #56 | Exceptional 5.5% |
| Immigrants | Europe | 99.0 /100 | #57 | Exceptional 5.5% |
| Danes | 98.9 /100 | #58 | Exceptional 5.5% |
| Luxembourgers | 98.7 /100 | #59 | Exceptional 5.6% |
| Immigrants | Norway | 98.7 /100 | #60 | Exceptional 5.6% |
| Australians | 98.7 /100 | #61 | Exceptional 5.6% |
| Poles | 98.6 /100 | #62 | Exceptional 5.6% |
| Immigrants | North Macedonia | 98.6 /100 | #63 | Exceptional 5.6% |
| Immigrants | France | 98.6 /100 | #64 | Exceptional 5.6% |
| Greeks | 98.6 /100 | #65 | Exceptional 5.6% |
| Immigrants | Canada | 98.5 /100 | #66 | Exceptional 5.6% |
| Italians | 98.5 /100 | #67 | Exceptional 5.6% |
| Immigrants | Bulgaria | 98.5 /100 | #68 | Exceptional 5.6% |
Demographics Similar to Immigrants from Cambodia by Single Mother Households
In terms of single mother households, the demographic groups most similar to Immigrants from Cambodia are Nicaraguan (7.2%, a difference of 0.18%), Cuban (7.2%, a difference of 0.34%), Ecuadorian (7.2%, a difference of 0.41%), Dutch West Indian (7.3%, a difference of 0.43%), and Fijian (7.2%, a difference of 0.46%).
| Demographics | Rating | Rank | Single Mother Households |
| Panamanians | 0.9 /100 | #238 | Tragic 7.1% |
| Kiowa | 0.8 /100 | #239 | Tragic 7.1% |
| Immigrants | Panama | 0.7 /100 | #240 | Tragic 7.2% |
| Immigrants | Portugal | 0.6 /100 | #241 | Tragic 7.2% |
| Fijians | 0.6 /100 | #242 | Tragic 7.2% |
| Ecuadorians | 0.6 /100 | #243 | Tragic 7.2% |
| Cubans | 0.6 /100 | #244 | Tragic 7.2% |
| Immigrants | Cambodia | 0.5 /100 | #245 | Tragic 7.2% |
| Nicaraguans | 0.5 /100 | #246 | Tragic 7.2% |
| Dutch West Indians | 0.4 /100 | #247 | Tragic 7.3% |
| Spanish American Indians | 0.4 /100 | #248 | Tragic 7.3% |
| Bermudans | 0.4 /100 | #249 | Tragic 7.3% |
| Immigrants | Africa | 0.4 /100 | #250 | Tragic 7.3% |
| Malaysians | 0.3 /100 | #251 | Tragic 7.3% |
| Alaskan Athabascans | 0.3 /100 | #252 | Tragic 7.3% |