Assyrian/Chaldean/Syriac vs West Indian 6th Grade
COMPARE
Assyrian/Chaldean/Syriac
West Indian
6th Grade
6th Grade Comparison
Assyrians/Chaldeans/Syriacs
West Indians
96.7%
6TH GRADE
4.0/ 100
METRIC RATING
229th/ 347
METRIC RANK
96.3%
6TH GRADE
0.2/ 100
METRIC RATING
269th/ 347
METRIC RANK
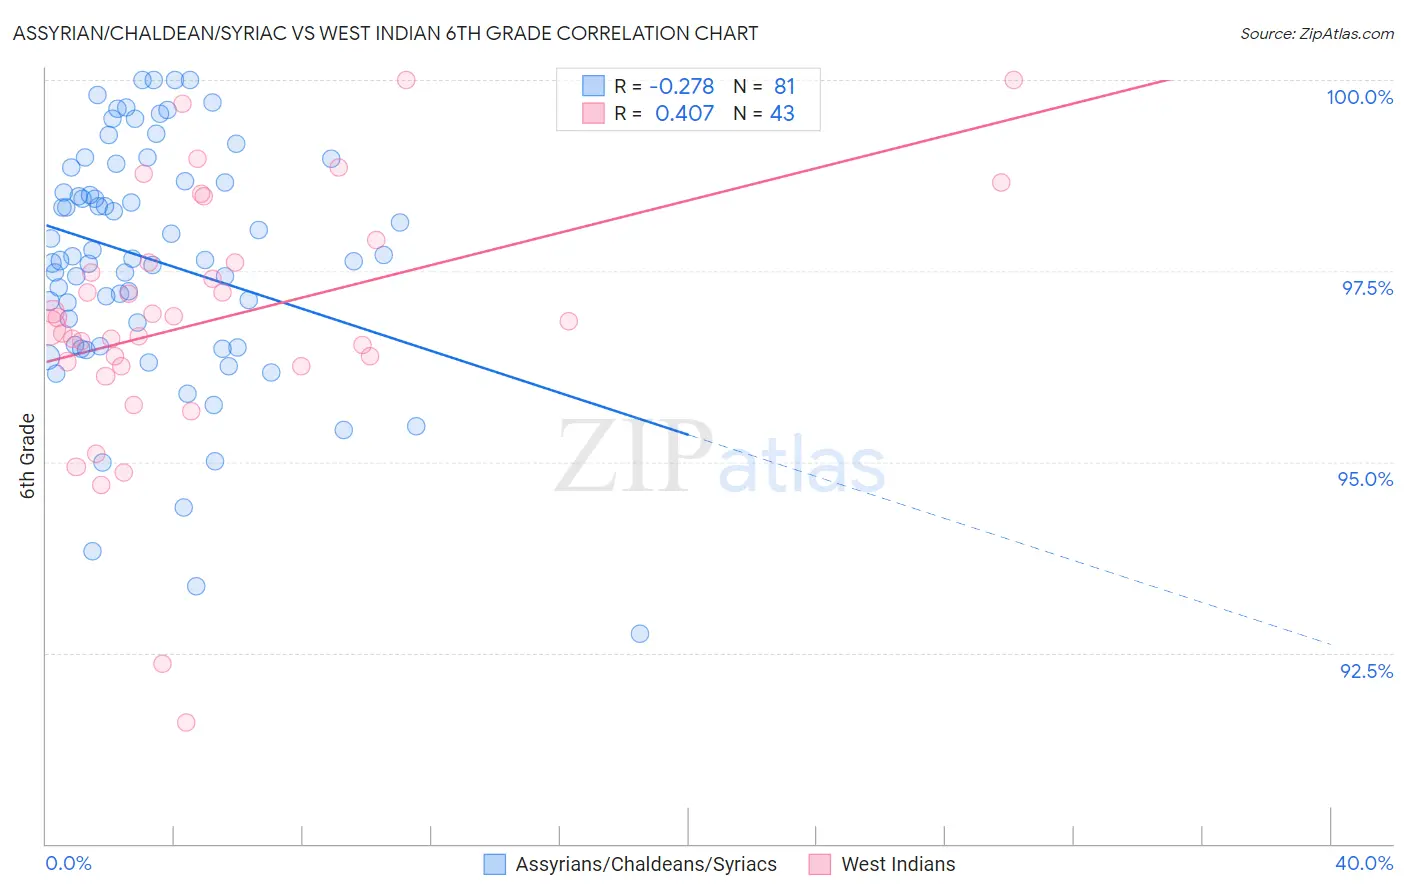
Assyrian/Chaldean/Syriac vs West Indian 6th Grade Correlation Chart
The statistical analysis conducted on geographies consisting of 110,318,304 people shows a weak negative correlation between the proportion of Assyrians/Chaldeans/Syriacs and percentage of population with at least 6th grade education in the United States with a correlation coefficient (R) of -0.278 and weighted average of 96.7%. Similarly, the statistical analysis conducted on geographies consisting of 254,059,006 people shows a moderate positive correlation between the proportion of West Indians and percentage of population with at least 6th grade education in the United States with a correlation coefficient (R) of 0.407 and weighted average of 96.3%, a difference of 0.37%.
6th Grade Correlation Summary
| Measurement | Assyrian/Chaldean/Syriac | West Indian |
| Minimum | 92.8% | 91.6% |
| Maximum | 100.0% | 100.0% |
| Range | 7.2% | 8.4% |
| Mean | 97.6% | 96.9% |
| Median | 97.7% | 96.8% |
| Interquartile 25% (IQ1) | 96.5% | 96.3% |
| Interquartile 75% (IQ3) | 98.8% | 97.6% |
| Interquartile Range (IQR) | 2.2% | 1.4% |
| Standard Deviation (Sample) | 1.6% | 1.7% |
| Standard Deviation (Population) | 1.6% | 1.7% |
Similar Demographics by 6th Grade
Demographics Similar to Assyrians/Chaldeans/Syriacs by 6th Grade
In terms of 6th grade, the demographic groups most similar to Assyrians/Chaldeans/Syriacs are Immigrants from Western Asia (96.7%, a difference of 0.0%), Immigrants from Malaysia (96.7%, a difference of 0.0%), Immigrants from Eastern Asia (96.7%, a difference of 0.0%), Immigrants from Southern Europe (96.7%, a difference of 0.010%), and Immigrants from Pakistan (96.7%, a difference of 0.010%).
| Demographics | Rating | Rank | 6th Grade |
| Immigrants | Syria | 5.9 /100 | #222 | Tragic 96.7% |
| Bahamians | 4.8 /100 | #223 | Tragic 96.7% |
| Immigrants | Southern Europe | 4.4 /100 | #224 | Tragic 96.7% |
| Immigrants | Pakistan | 4.4 /100 | #225 | Tragic 96.7% |
| Immigrants | Panama | 4.2 /100 | #226 | Tragic 96.7% |
| Immigrants | Western Asia | 4.1 /100 | #227 | Tragic 96.7% |
| Immigrants | Malaysia | 4.0 /100 | #228 | Tragic 96.7% |
| Assyrians/Chaldeans/Syriacs | 4.0 /100 | #229 | Tragic 96.7% |
| Immigrants | Eastern Asia | 4.0 /100 | #230 | Tragic 96.7% |
| Sub-Saharan Africans | 3.5 /100 | #231 | Tragic 96.7% |
| South American Indians | 3.5 /100 | #232 | Tragic 96.7% |
| Yuman | 3.2 /100 | #233 | Tragic 96.7% |
| Uruguayans | 2.5 /100 | #234 | Tragic 96.6% |
| Asians | 2.4 /100 | #235 | Tragic 96.6% |
| Immigrants | Indonesia | 2.3 /100 | #236 | Tragic 96.6% |
Demographics Similar to West Indians by 6th Grade
In terms of 6th grade, the demographic groups most similar to West Indians are Immigrants from Uzbekistan (96.3%, a difference of 0.0%), Immigrants from South America (96.3%, a difference of 0.0%), Immigrants from Hong Kong (96.3%, a difference of 0.010%), Ghanaian (96.4%, a difference of 0.030%), and Afghan (96.4%, a difference of 0.030%).
| Demographics | Rating | Rank | 6th Grade |
| Immigrants | Nigeria | 0.3 /100 | #262 | Tragic 96.4% |
| Immigrants | Colombia | 0.3 /100 | #263 | Tragic 96.4% |
| Armenians | 0.3 /100 | #264 | Tragic 96.4% |
| Immigrants | Jamaica | 0.2 /100 | #265 | Tragic 96.4% |
| Ghanaians | 0.2 /100 | #266 | Tragic 96.4% |
| Afghans | 0.2 /100 | #267 | Tragic 96.4% |
| Immigrants | Uzbekistan | 0.2 /100 | #268 | Tragic 96.3% |
| West Indians | 0.2 /100 | #269 | Tragic 96.3% |
| Immigrants | South America | 0.2 /100 | #270 | Tragic 96.3% |
| Immigrants | Hong Kong | 0.2 /100 | #271 | Tragic 96.3% |
| Immigrants | Bolivia | 0.1 /100 | #272 | Tragic 96.3% |
| Immigrants | Cameroon | 0.1 /100 | #273 | Tragic 96.3% |
| Immigrants | Philippines | 0.1 /100 | #274 | Tragic 96.3% |
| Immigrants | Ghana | 0.1 /100 | #275 | Tragic 96.3% |
| Yaqui | 0.1 /100 | #276 | Tragic 96.3% |