Immigrants from Dominican Republic vs West Indian Single Mother Households
COMPARE
Immigrants from Dominican Republic
West Indian
Single Mother Households
Single Mother Households Comparison
Immigrants from Dominican Republic
West Indians
9.5%
SINGLE MOTHER HOUSEHOLDS
0.0/ 100
METRIC RATING
344th/ 347
METRIC RANK
7.8%
SINGLE MOTHER HOUSEHOLDS
0.0/ 100
METRIC RATING
291st/ 347
METRIC RANK
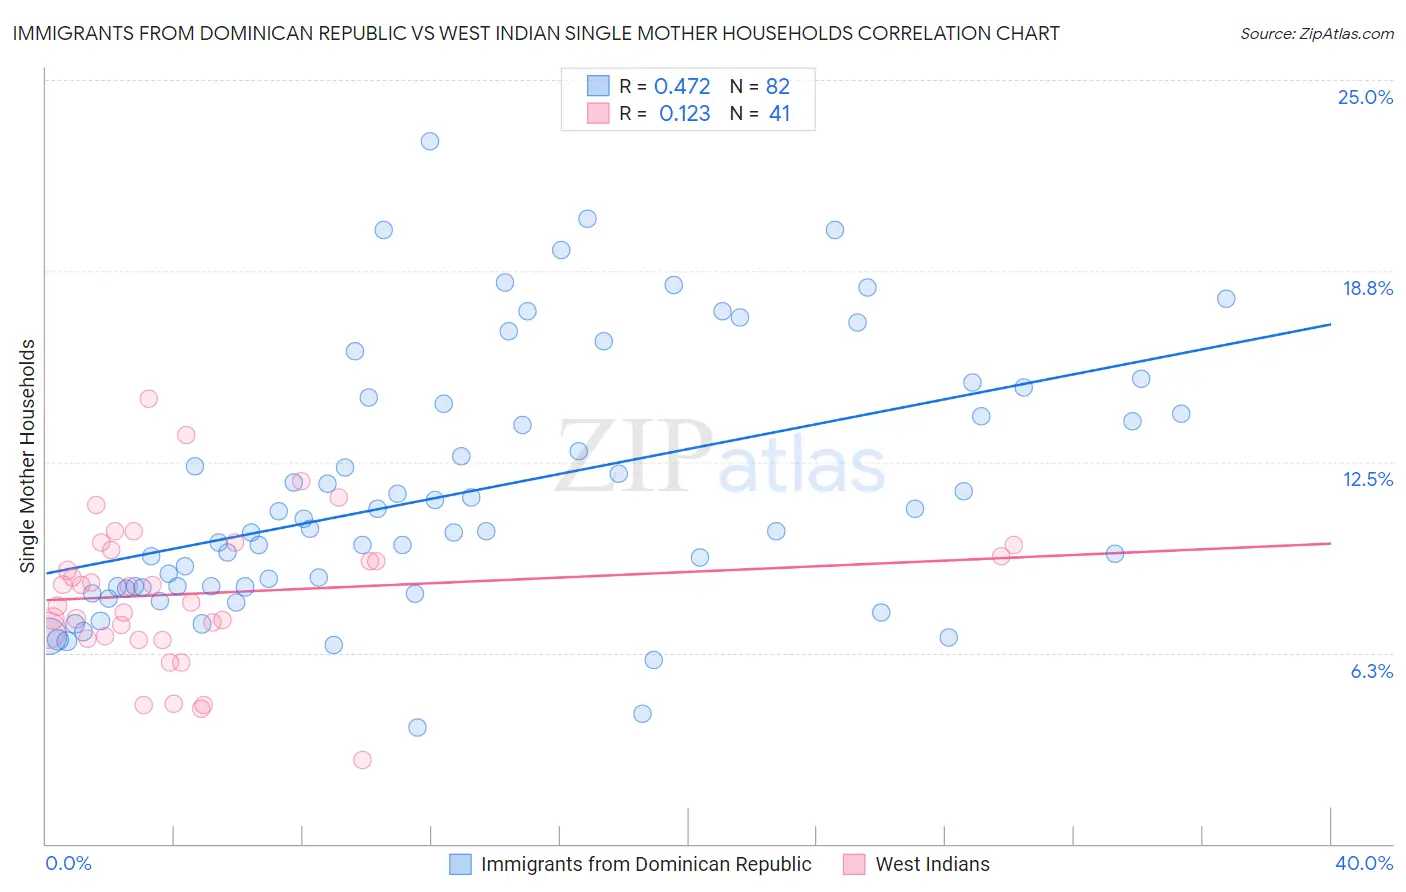
Immigrants from Dominican Republic vs West Indian Single Mother Households Correlation Chart
The statistical analysis conducted on geographies consisting of 274,598,570 people shows a moderate positive correlation between the proportion of Immigrants from Dominican Republic and percentage of single mother households in the United States with a correlation coefficient (R) of 0.472 and weighted average of 9.5%. Similarly, the statistical analysis conducted on geographies consisting of 253,636,712 people shows a poor positive correlation between the proportion of West Indians and percentage of single mother households in the United States with a correlation coefficient (R) of 0.123 and weighted average of 7.8%, a difference of 21.1%.
Single Mother Households Correlation Summary
| Measurement | Immigrants from Dominican Republic | West Indian |
| Minimum | 3.8% | 2.7% |
| Maximum | 23.0% | 14.6% |
| Range | 19.2% | 11.8% |
| Mean | 11.5% | 8.2% |
| Median | 10.3% | 8.4% |
| Interquartile 25% (IQ1) | 8.4% | 6.8% |
| Interquartile 75% (IQ3) | 14.4% | 9.7% |
| Interquartile Range (IQR) | 6.0% | 2.9% |
| Standard Deviation (Sample) | 4.2% | 2.4% |
| Standard Deviation (Population) | 4.2% | 2.4% |
Similar Demographics by Single Mother Households
Demographics Similar to Immigrants from Dominican Republic by Single Mother Households
In terms of single mother households, the demographic groups most similar to Immigrants from Dominican Republic are Immigrants from Cabo Verde (9.6%, a difference of 0.78%), Yuman (9.6%, a difference of 1.4%), Dominican (9.2%, a difference of 3.5%), Menominee (9.2%, a difference of 3.7%), and Tohono O'odham (9.1%, a difference of 4.1%).
| Demographics | Rating | Rank | Single Mother Households |
| Liberians | 0.0 /100 | #333 | Tragic 8.6% |
| Immigrants | Liberia | 0.0 /100 | #334 | Tragic 8.7% |
| Immigrants | Dominica | 0.0 /100 | #335 | Tragic 8.7% |
| Puerto Ricans | 0.0 /100 | #336 | Tragic 8.7% |
| Navajo | 0.0 /100 | #337 | Tragic 8.8% |
| Cape Verdeans | 0.0 /100 | #338 | Tragic 8.9% |
| Blacks/African Americans | 0.0 /100 | #339 | Tragic 9.0% |
| Lumbee | 0.0 /100 | #340 | Tragic 9.1% |
| Tohono O'odham | 0.0 /100 | #341 | Tragic 9.1% |
| Menominee | 0.0 /100 | #342 | Tragic 9.2% |
| Dominicans | 0.0 /100 | #343 | Tragic 9.2% |
| Immigrants | Dominican Republic | 0.0 /100 | #344 | Tragic 9.5% |
| Immigrants | Cabo Verde | 0.0 /100 | #345 | Tragic 9.6% |
| Yuman | 0.0 /100 | #346 | Tragic 9.6% |
| Yup'ik | 0.0 /100 | #347 | Tragic 10.0% |
Demographics Similar to West Indians by Single Mother Households
In terms of single mother households, the demographic groups most similar to West Indians are Ghanaian (7.8%, a difference of 0.010%), Immigrants from Nigeria (7.8%, a difference of 0.080%), Immigrants from Cameroon (7.9%, a difference of 0.37%), Apache (7.9%, a difference of 0.47%), and Subsaharan African (7.8%, a difference of 0.50%).
| Demographics | Rating | Rank | Single Mother Households |
| Immigrants | Belize | 0.0 /100 | #284 | Tragic 7.7% |
| Trinidadians and Tobagonians | 0.0 /100 | #285 | Tragic 7.7% |
| Immigrants | Middle Africa | 0.0 /100 | #286 | Tragic 7.7% |
| Immigrants | Guatemala | 0.0 /100 | #287 | Tragic 7.7% |
| Sierra Leoneans | 0.0 /100 | #288 | Tragic 7.7% |
| Sub-Saharan Africans | 0.0 /100 | #289 | Tragic 7.8% |
| Immigrants | Nigeria | 0.0 /100 | #290 | Tragic 7.8% |
| West Indians | 0.0 /100 | #291 | Tragic 7.8% |
| Ghanaians | 0.0 /100 | #292 | Tragic 7.8% |
| Immigrants | Cameroon | 0.0 /100 | #293 | Tragic 7.9% |
| Apache | 0.0 /100 | #294 | Tragic 7.9% |
| Barbadians | 0.0 /100 | #295 | Tragic 7.9% |
| Immigrants | Latin America | 0.0 /100 | #296 | Tragic 7.9% |
| Hispanics or Latinos | 0.0 /100 | #297 | Tragic 7.9% |
| Immigrants | West Indies | 0.0 /100 | #298 | Tragic 7.9% |