Assyrian/Chaldean/Syriac vs Welsh Unemployment Among Women with Children Under 18 years
COMPARE
Assyrian/Chaldean/Syriac
Welsh
Unemployment Among Women with Children Under 18 years
Unemployment Among Women with Children Under 18 years Comparison
Assyrians/Chaldeans/Syriacs
Welsh
5.1%
UNEMPLOYMENT AMONG WOMEN WITH CHILDREN UNDER 18 YEARS
95.7/ 100
METRIC RATING
78th/ 347
METRIC RANK
5.1%
UNEMPLOYMENT AMONG WOMEN WITH CHILDREN UNDER 18 YEARS
97.7/ 100
METRIC RATING
60th/ 347
METRIC RANK
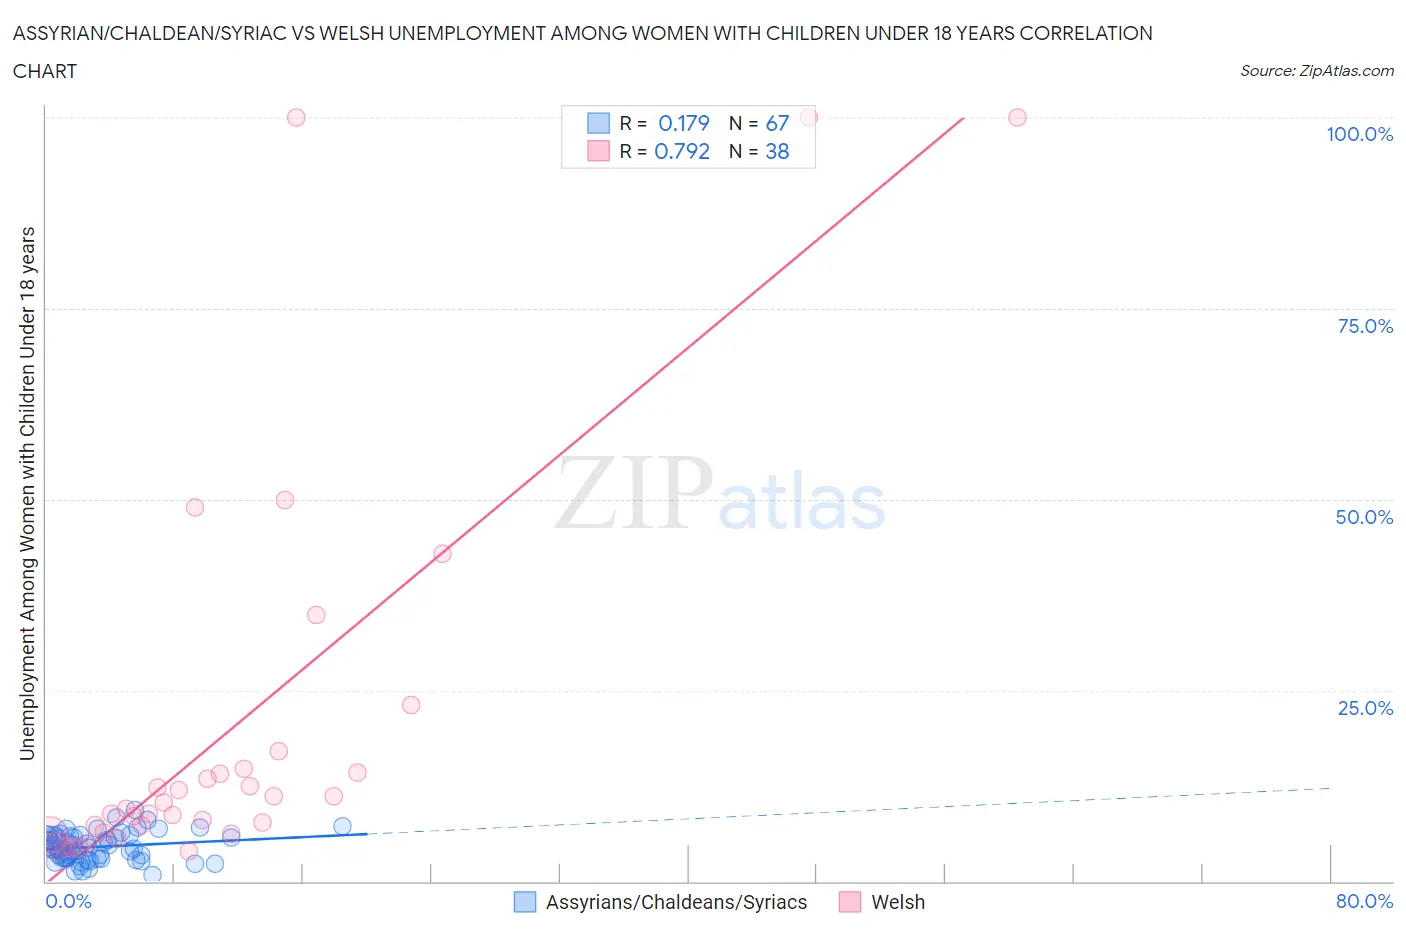
Assyrian/Chaldean/Syriac vs Welsh Unemployment Among Women with Children Under 18 years Correlation Chart
The statistical analysis conducted on geographies consisting of 108,875,317 people shows a poor positive correlation between the proportion of Assyrians/Chaldeans/Syriacs and unemployment rate among women with children under the age of 18 in the United States with a correlation coefficient (R) of 0.179 and weighted average of 5.1%. Similarly, the statistical analysis conducted on geographies consisting of 484,131,801 people shows a strong positive correlation between the proportion of Welsh and unemployment rate among women with children under the age of 18 in the United States with a correlation coefficient (R) of 0.792 and weighted average of 5.1%, a difference of 1.2%.
Unemployment Among Women with Children Under 18 years Correlation Summary
| Measurement | Assyrian/Chaldean/Syriac | Welsh |
| Minimum | 0.80% | 3.9% |
| Maximum | 9.3% | 100.0% |
| Range | 8.5% | 96.1% |
| Mean | 4.5% | 20.2% |
| Median | 4.2% | 9.8% |
| Interquartile 25% (IQ1) | 3.0% | 6.3% |
| Interquartile 75% (IQ3) | 5.8% | 14.8% |
| Interquartile Range (IQR) | 2.8% | 8.5% |
| Standard Deviation (Sample) | 1.8% | 26.4% |
| Standard Deviation (Population) | 1.8% | 26.0% |
Demographics Similar to Assyrians/Chaldeans/Syriacs and Welsh by Unemployment Among Women with Children Under 18 years
In terms of unemployment among women with children under 18 years, the demographic groups most similar to Assyrians/Chaldeans/Syriacs are Zimbabwean (5.1%, a difference of 0.020%), Immigrants from Croatia (5.1%, a difference of 0.020%), Puget Sound Salish (5.1%, a difference of 0.040%), Immigrants from Asia (5.1%, a difference of 0.070%), and Immigrants from Northern Europe (5.1%, a difference of 0.10%). Similarly, the demographic groups most similar to Welsh are Asian (5.1%, a difference of 0.15%), Russian (5.1%, a difference of 0.15%), Immigrants from Bulgaria (5.1%, a difference of 0.22%), Italian (5.1%, a difference of 0.23%), and Estonian (5.1%, a difference of 0.41%).
| Demographics | Rating | Rank | Unemployment Among Women with Children Under 18 years |
| Asians | 97.9 /100 | #59 | Exceptional 5.1% |
| Welsh | 97.7 /100 | #60 | Exceptional 5.1% |
| Russians | 97.5 /100 | #61 | Exceptional 5.1% |
| Immigrants | Bulgaria | 97.4 /100 | #62 | Exceptional 5.1% |
| Italians | 97.4 /100 | #63 | Exceptional 5.1% |
| Estonians | 97.2 /100 | #64 | Exceptional 5.1% |
| Immigrants | Sweden | 97.1 /100 | #65 | Exceptional 5.1% |
| Immigrants | Australia | 97.0 /100 | #66 | Exceptional 5.1% |
| Fijians | 96.9 /100 | #67 | Exceptional 5.1% |
| Irish | 96.8 /100 | #68 | Exceptional 5.1% |
| Austrians | 96.6 /100 | #69 | Exceptional 5.1% |
| Icelanders | 96.6 /100 | #70 | Exceptional 5.1% |
| Serbians | 96.5 /100 | #71 | Exceptional 5.1% |
| Immigrants | Bolivia | 96.1 /100 | #72 | Exceptional 5.1% |
| Albanians | 95.9 /100 | #73 | Exceptional 5.1% |
| Immigrants | Northern Europe | 95.9 /100 | #74 | Exceptional 5.1% |
| Immigrants | Asia | 95.8 /100 | #75 | Exceptional 5.1% |
| Puget Sound Salish | 95.8 /100 | #76 | Exceptional 5.1% |
| Zimbabweans | 95.7 /100 | #77 | Exceptional 5.1% |
| Assyrians/Chaldeans/Syriacs | 95.7 /100 | #78 | Exceptional 5.1% |
| Immigrants | Croatia | 95.6 /100 | #79 | Exceptional 5.1% |