Immigrants from Sudan vs Welsh Single Father Households
COMPARE
Immigrants from Sudan
Welsh
Single Father Households
Single Father Households Comparison
Immigrants from Sudan
Welsh
2.4%
SINGLE FATHER HOUSEHOLDS
29.8/ 100
METRIC RATING
192nd/ 347
METRIC RANK
2.3%
SINGLE FATHER HOUSEHOLDS
44.0/ 100
METRIC RATING
179th/ 347
METRIC RANK
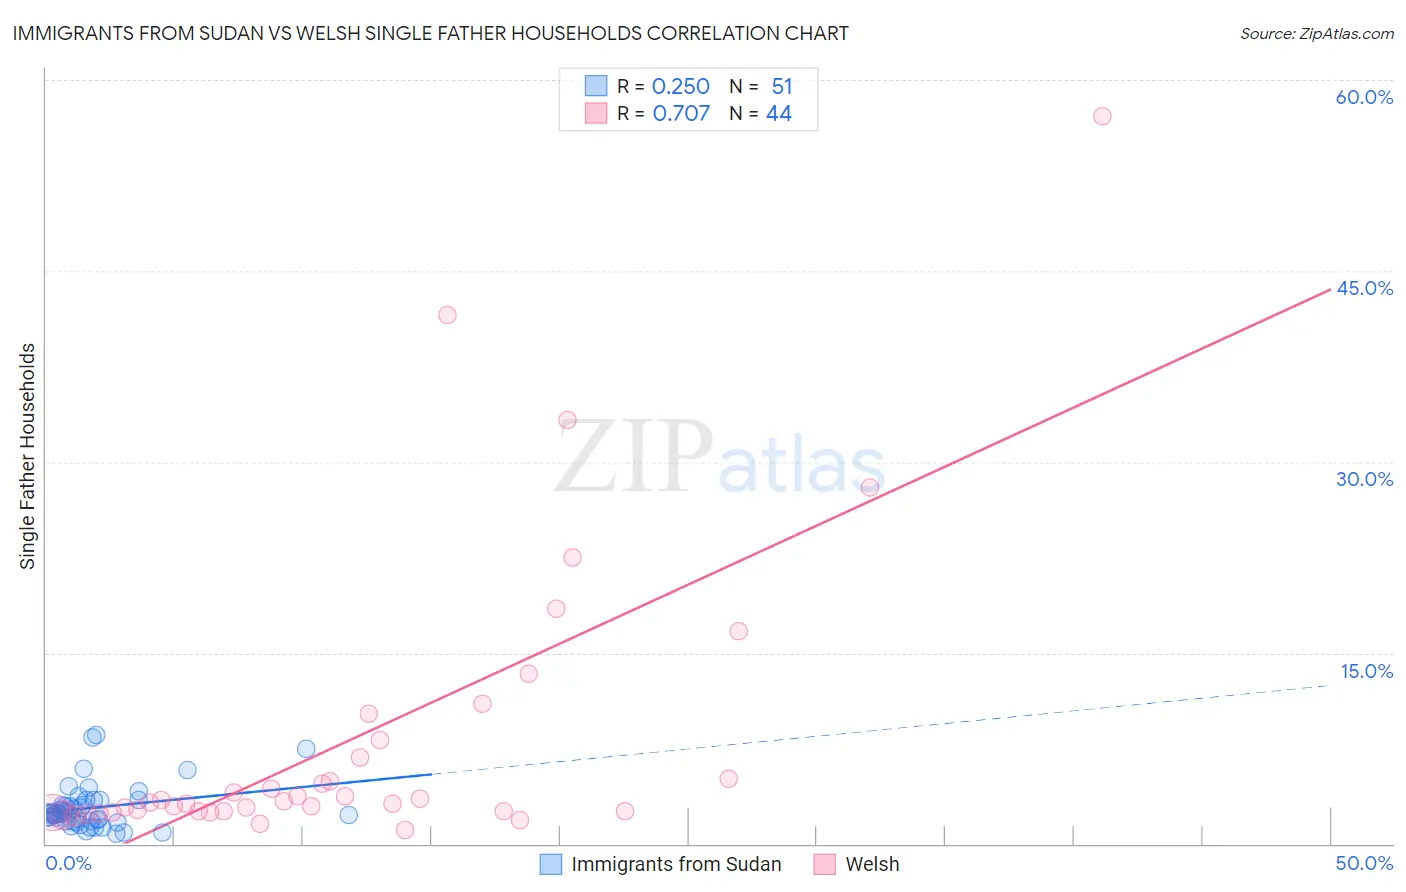
Immigrants from Sudan vs Welsh Single Father Households Correlation Chart
The statistical analysis conducted on geographies consisting of 118,770,797 people shows a weak positive correlation between the proportion of Immigrants from Sudan and percentage of single father households in the United States with a correlation coefficient (R) of 0.250 and weighted average of 2.4%. Similarly, the statistical analysis conducted on geographies consisting of 518,370,143 people shows a strong positive correlation between the proportion of Welsh and percentage of single father households in the United States with a correlation coefficient (R) of 0.707 and weighted average of 2.3%, a difference of 1.1%.
Single Father Households Correlation Summary
| Measurement | Immigrants from Sudan | Welsh |
| Minimum | 0.77% | 1.1% |
| Maximum | 8.6% | 57.1% |
| Range | 7.8% | 56.0% |
| Mean | 2.8% | 8.3% |
| Median | 2.4% | 3.3% |
| Interquartile 25% (IQ1) | 1.8% | 2.6% |
| Interquartile 75% (IQ3) | 3.4% | 7.5% |
| Interquartile Range (IQR) | 1.7% | 4.9% |
| Standard Deviation (Sample) | 1.7% | 11.7% |
| Standard Deviation (Population) | 1.7% | 11.5% |
Demographics Similar to Immigrants from Sudan and Welsh by Single Father Households
In terms of single father households, the demographic groups most similar to Immigrants from Sudan are Immigrants from Africa (2.4%, a difference of 0.010%), Uruguayan (2.4%, a difference of 0.010%), Panamanian (2.4%, a difference of 0.020%), Immigrants from Philippines (2.4%, a difference of 0.10%), and French (2.4%, a difference of 0.16%). Similarly, the demographic groups most similar to Welsh are Costa Rican (2.3%, a difference of 0.0%), Yugoslavian (2.3%, a difference of 0.010%), Jamaican (2.3%, a difference of 0.040%), Belgian (2.3%, a difference of 0.060%), and Immigrants from Panama (2.4%, a difference of 0.16%).
| Demographics | Rating | Rank | Single Father Households |
| Immigrants | Jamaica | 49.1 /100 | #175 | Average 2.3% |
| Danes | 48.2 /100 | #176 | Average 2.3% |
| Colombians | 48.0 /100 | #177 | Average 2.3% |
| Costa Ricans | 44.1 /100 | #178 | Average 2.3% |
| Welsh | 44.0 /100 | #179 | Average 2.3% |
| Yugoslavians | 43.9 /100 | #180 | Average 2.3% |
| Jamaicans | 43.5 /100 | #181 | Average 2.3% |
| Belgians | 43.3 /100 | #182 | Average 2.3% |
| Immigrants | Panama | 41.8 /100 | #183 | Average 2.4% |
| Sri Lankans | 41.8 /100 | #184 | Average 2.4% |
| Nigerians | 41.0 /100 | #185 | Average 2.4% |
| Immigrants | Bosnia and Herzegovina | 40.4 /100 | #186 | Average 2.4% |
| Immigrants | Colombia | 34.0 /100 | #187 | Fair 2.4% |
| Hmong | 33.0 /100 | #188 | Fair 2.4% |
| U.S. Virgin Islanders | 31.8 /100 | #189 | Fair 2.4% |
| French | 31.7 /100 | #190 | Fair 2.4% |
| Immigrants | Africa | 30.0 /100 | #191 | Fair 2.4% |
| Immigrants | Sudan | 29.8 /100 | #192 | Fair 2.4% |
| Uruguayans | 29.7 /100 | #193 | Fair 2.4% |
| Panamanians | 29.6 /100 | #194 | Fair 2.4% |
| Immigrants | Philippines | 28.7 /100 | #195 | Fair 2.4% |