Assyrian/Chaldean/Syriac vs Spanish Divorced or Separated
COMPARE
Assyrian/Chaldean/Syriac
Spanish
Divorced or Separated
Divorced or Separated Comparison
Assyrians/Chaldeans/Syriacs
Spanish
10.6%
DIVORCED OR SEPARATED
100.0/ 100
METRIC RATING
14th/ 347
METRIC RANK
12.8%
DIVORCED OR SEPARATED
0.1/ 100
METRIC RATING
286th/ 347
METRIC RANK
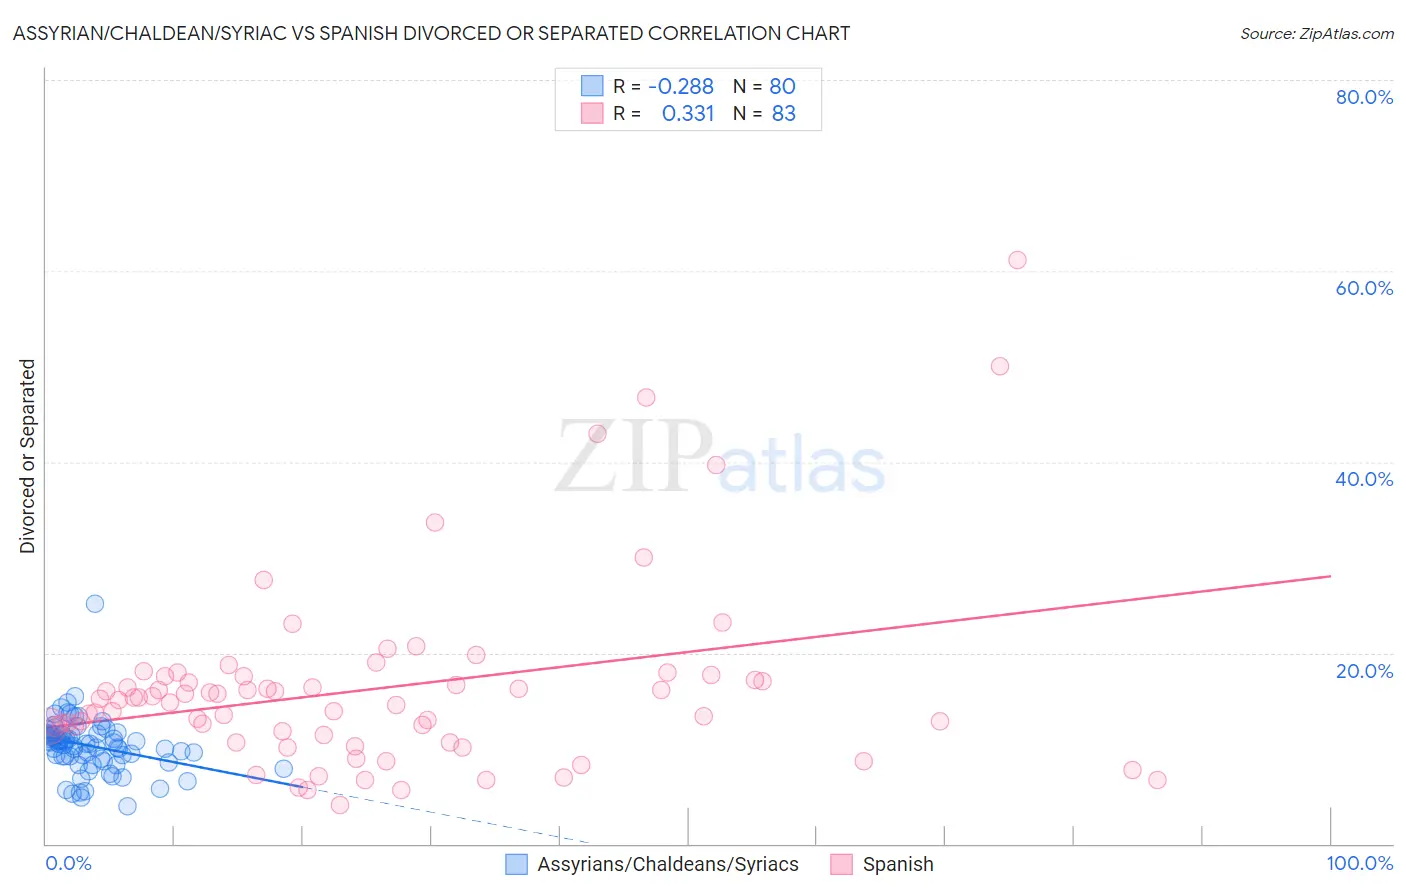
Assyrian/Chaldean/Syriac vs Spanish Divorced or Separated Correlation Chart
The statistical analysis conducted on geographies consisting of 110,313,686 people shows a weak negative correlation between the proportion of Assyrians/Chaldeans/Syriacs and percentage of population currently divorced or separated in the United States with a correlation coefficient (R) of -0.288 and weighted average of 10.6%. Similarly, the statistical analysis conducted on geographies consisting of 422,013,877 people shows a mild positive correlation between the proportion of Spanish and percentage of population currently divorced or separated in the United States with a correlation coefficient (R) of 0.331 and weighted average of 12.8%, a difference of 21.1%.
Divorced or Separated Correlation Summary
| Measurement | Assyrian/Chaldean/Syriac | Spanish |
| Minimum | 3.9% | 4.0% |
| Maximum | 25.1% | 61.2% |
| Range | 21.2% | 57.2% |
| Mean | 10.3% | 16.3% |
| Median | 10.5% | 15.1% |
| Interquartile 25% (IQ1) | 9.0% | 11.4% |
| Interquartile 75% (IQ3) | 11.5% | 17.6% |
| Interquartile Range (IQR) | 2.5% | 6.1% |
| Standard Deviation (Sample) | 2.9% | 9.8% |
| Standard Deviation (Population) | 2.9% | 9.7% |
Similar Demographics by Divorced or Separated
Demographics Similar to Assyrians/Chaldeans/Syriacs by Divorced or Separated
In terms of divorced or separated, the demographic groups most similar to Assyrians/Chaldeans/Syriacs are Immigrants from Armenia (10.6%, a difference of 0.070%), Immigrants from Korea (10.6%, a difference of 0.51%), Immigrants from Israel (10.6%, a difference of 0.62%), Immigrants from Iran (10.6%, a difference of 0.70%), and Asian (10.6%, a difference of 0.71%).
| Demographics | Rating | Rank | Divorced or Separated |
| Thais | 100.0 /100 | #7 | Exceptional 10.2% |
| Immigrants | Eastern Asia | 100.0 /100 | #8 | Exceptional 10.2% |
| Yup'ik | 100.0 /100 | #9 | Exceptional 10.3% |
| Immigrants | Singapore | 100.0 /100 | #10 | Exceptional 10.3% |
| Immigrants | South Central Asia | 100.0 /100 | #11 | Exceptional 10.4% |
| Okinawans | 100.0 /100 | #12 | Exceptional 10.5% |
| Cypriots | 100.0 /100 | #13 | Exceptional 10.5% |
| Assyrians/Chaldeans/Syriacs | 100.0 /100 | #14 | Exceptional 10.6% |
| Immigrants | Armenia | 100.0 /100 | #15 | Exceptional 10.6% |
| Immigrants | Korea | 100.0 /100 | #16 | Exceptional 10.6% |
| Immigrants | Israel | 100.0 /100 | #17 | Exceptional 10.6% |
| Immigrants | Iran | 100.0 /100 | #18 | Exceptional 10.6% |
| Asians | 100.0 /100 | #19 | Exceptional 10.6% |
| Burmese | 100.0 /100 | #20 | Exceptional 10.7% |
| Immigrants | Asia | 100.0 /100 | #21 | Exceptional 10.7% |
Demographics Similar to Spanish by Divorced or Separated
In terms of divorced or separated, the demographic groups most similar to Spanish are Honduran (12.8%, a difference of 0.19%), French (12.8%, a difference of 0.23%), Nonimmigrants (12.8%, a difference of 0.26%), Delaware (12.7%, a difference of 0.35%), and Subsaharan African (12.7%, a difference of 0.36%).
| Demographics | Rating | Rank | Divorced or Separated |
| Immigrants | Dominican Republic | 0.2 /100 | #279 | Tragic 12.7% |
| Immigrants | Zaire | 0.2 /100 | #280 | Tragic 12.7% |
| Pueblo | 0.2 /100 | #281 | Tragic 12.7% |
| Sub-Saharan Africans | 0.1 /100 | #282 | Tragic 12.7% |
| Delaware | 0.1 /100 | #283 | Tragic 12.7% |
| Immigrants | Nonimmigrants | 0.1 /100 | #284 | Tragic 12.8% |
| French | 0.1 /100 | #285 | Tragic 12.8% |
| Spanish | 0.1 /100 | #286 | Tragic 12.8% |
| Hondurans | 0.1 /100 | #287 | Tragic 12.8% |
| French Canadians | 0.1 /100 | #288 | Tragic 12.8% |
| Iroquois | 0.0 /100 | #289 | Tragic 12.9% |
| Pima | 0.0 /100 | #290 | Tragic 12.9% |
| Immigrants | Honduras | 0.0 /100 | #291 | Tragic 12.9% |
| Scotch-Irish | 0.0 /100 | #292 | Tragic 12.9% |
| Jamaicans | 0.0 /100 | #293 | Tragic 12.9% |