Assyrian/Chaldean/Syriac vs Puerto Rican Divorced or Separated
COMPARE
Assyrian/Chaldean/Syriac
Puerto Rican
Divorced or Separated
Divorced or Separated Comparison
Assyrians/Chaldeans/Syriacs
Puerto Ricans
10.6%
DIVORCED OR SEPARATED
100.0/ 100
METRIC RATING
14th/ 347
METRIC RANK
13.9%
DIVORCED OR SEPARATED
0.0/ 100
METRIC RATING
333rd/ 347
METRIC RANK
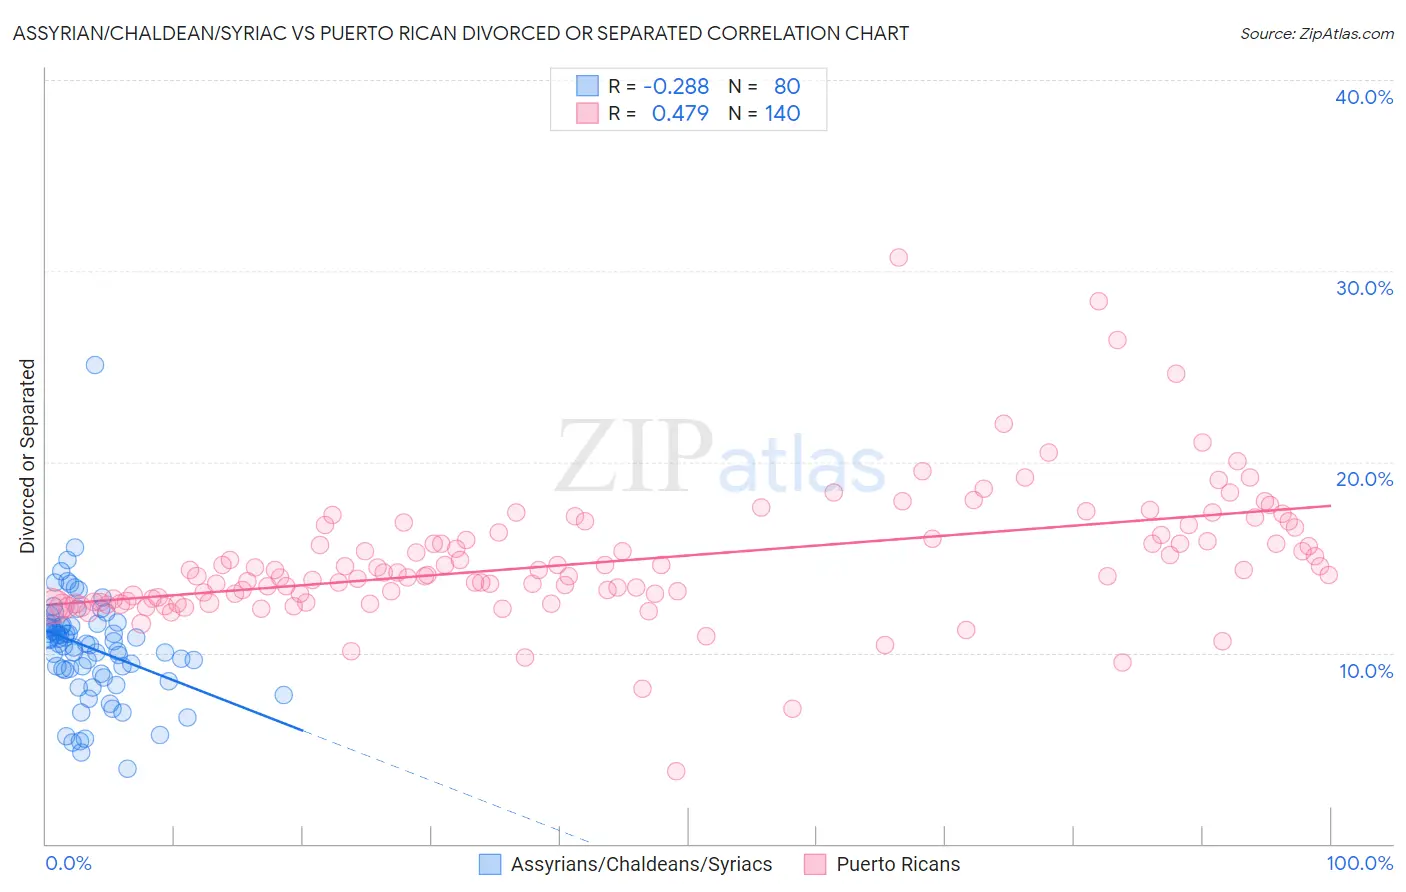
Assyrian/Chaldean/Syriac vs Puerto Rican Divorced or Separated Correlation Chart
The statistical analysis conducted on geographies consisting of 110,313,686 people shows a weak negative correlation between the proportion of Assyrians/Chaldeans/Syriacs and percentage of population currently divorced or separated in the United States with a correlation coefficient (R) of -0.288 and weighted average of 10.6%. Similarly, the statistical analysis conducted on geographies consisting of 527,942,852 people shows a moderate positive correlation between the proportion of Puerto Ricans and percentage of population currently divorced or separated in the United States with a correlation coefficient (R) of 0.479 and weighted average of 13.9%, a difference of 31.3%.
Divorced or Separated Correlation Summary
| Measurement | Assyrian/Chaldean/Syriac | Puerto Rican |
| Minimum | 3.9% | 3.8% |
| Maximum | 25.1% | 30.7% |
| Range | 21.2% | 26.9% |
| Mean | 10.3% | 14.8% |
| Median | 10.5% | 14.1% |
| Interquartile 25% (IQ1) | 9.0% | 12.7% |
| Interquartile 75% (IQ3) | 11.5% | 16.2% |
| Interquartile Range (IQR) | 2.5% | 3.5% |
| Standard Deviation (Sample) | 2.9% | 3.4% |
| Standard Deviation (Population) | 2.9% | 3.4% |
Similar Demographics by Divorced or Separated
Demographics Similar to Assyrians/Chaldeans/Syriacs by Divorced or Separated
In terms of divorced or separated, the demographic groups most similar to Assyrians/Chaldeans/Syriacs are Immigrants from Armenia (10.6%, a difference of 0.070%), Immigrants from Korea (10.6%, a difference of 0.51%), Immigrants from Israel (10.6%, a difference of 0.62%), Immigrants from Iran (10.6%, a difference of 0.70%), and Asian (10.6%, a difference of 0.71%).
| Demographics | Rating | Rank | Divorced or Separated |
| Thais | 100.0 /100 | #7 | Exceptional 10.2% |
| Immigrants | Eastern Asia | 100.0 /100 | #8 | Exceptional 10.2% |
| Yup'ik | 100.0 /100 | #9 | Exceptional 10.3% |
| Immigrants | Singapore | 100.0 /100 | #10 | Exceptional 10.3% |
| Immigrants | South Central Asia | 100.0 /100 | #11 | Exceptional 10.4% |
| Okinawans | 100.0 /100 | #12 | Exceptional 10.5% |
| Cypriots | 100.0 /100 | #13 | Exceptional 10.5% |
| Assyrians/Chaldeans/Syriacs | 100.0 /100 | #14 | Exceptional 10.6% |
| Immigrants | Armenia | 100.0 /100 | #15 | Exceptional 10.6% |
| Immigrants | Korea | 100.0 /100 | #16 | Exceptional 10.6% |
| Immigrants | Israel | 100.0 /100 | #17 | Exceptional 10.6% |
| Immigrants | Iran | 100.0 /100 | #18 | Exceptional 10.6% |
| Asians | 100.0 /100 | #19 | Exceptional 10.6% |
| Burmese | 100.0 /100 | #20 | Exceptional 10.7% |
| Immigrants | Asia | 100.0 /100 | #21 | Exceptional 10.7% |
Demographics Similar to Puerto Ricans by Divorced or Separated
In terms of divorced or separated, the demographic groups most similar to Puerto Ricans are Immigrants from Bahamas (13.9%, a difference of 0.34%), Cherokee (13.7%, a difference of 0.95%), Dutch West Indian (14.0%, a difference of 0.95%), Shoshone (14.0%, a difference of 1.3%), and Crow (14.1%, a difference of 1.6%).
| Demographics | Rating | Rank | Divorced or Separated |
| Immigrants | Congo | 0.0 /100 | #326 | Tragic 13.5% |
| Comanche | 0.0 /100 | #327 | Tragic 13.5% |
| Immigrants | Caribbean | 0.0 /100 | #328 | Tragic 13.6% |
| Houma | 0.0 /100 | #329 | Tragic 13.6% |
| Paiute | 0.0 /100 | #330 | Tragic 13.6% |
| Blacks/African Americans | 0.0 /100 | #331 | Tragic 13.6% |
| Cherokee | 0.0 /100 | #332 | Tragic 13.7% |
| Puerto Ricans | 0.0 /100 | #333 | Tragic 13.9% |
| Immigrants | Bahamas | 0.0 /100 | #334 | Tragic 13.9% |
| Dutch West Indians | 0.0 /100 | #335 | Tragic 14.0% |
| Shoshone | 0.0 /100 | #336 | Tragic 14.0% |
| Crow | 0.0 /100 | #337 | Tragic 14.1% |
| Choctaw | 0.0 /100 | #338 | Tragic 14.1% |
| Colville | 0.0 /100 | #339 | Tragic 14.2% |
| Chickasaw | 0.0 /100 | #340 | Tragic 14.2% |