Assyrian/Chaldean/Syriac vs Immigrants from Croatia Divorced or Separated

COMPARE

Assyrian/Chaldean/Syriac
Race
Ancestry
AfghanAfricanAlaska NativeAlaskan AthabascanAlbanianAleutAlsatianAmericanApacheArabArapahoArgentineanArmenianAssyrian/Chaldean/SyriacAustralianAustrianBahamianBangladeshiBarbadianBasqueBelgianBelizeanBermudanBhutaneseBlackfeetBolivianBrazilianBritishBritish West IndianBulgarianBurmeseCajunCambodianCanadianCape VerdeanCarpatho RusynCelticCentral AmericanCentral American IndianCherokeeCheyenneChickasawChileanChineseChippewaChoctawColombianColvilleComancheCosta RicanCreeCreekCroatianCrowCubanCypriotCzechCzechoslovakianDanishDelawareDominicanDutchDutch West IndianEastern EuropeanEcuadorianEgyptianEnglishEstonianEthiopianEuropeanFijianFilipinoFinnishFrenchFrench American IndianFrench CanadianGermanGerman RussianGhanaianGreekGuamanian/ChamorroGuatemalanGuyaneseHaitianHmongHonduranHopiHoumaHungarianIcelanderIndian (Asian)IndonesianInupiatIranianIraqiIrishIroquoisIsraeliItalianJamaicanJapaneseJordanianKenyanKiowaKoreanLaotianLatvianLebaneseLiberianLithuanianLumbeeLuxembourgerMacedonianMalaysianMalteseMarshalleseMenomineeMexicanMexican American IndianMongolianMoroccanNative HawaiianNavajoNepaleseNew ZealanderNicaraguanNigerianNorthern EuropeanNorwegianOkinawanOsageOttawaPaiutePakistaniPalestinianPanamanianParaguayanPennsylvania GermanPeruvianPimaPolishPortuguesePotawatomiPuebloPuerto RicanPuget Sound SalishRomanianRussianSalvadoranSamoanScandinavianScotch-IrishScottishSeminoleSenegaleseSerbianShoshoneSierra LeoneanSiouxSlavicSlovakSloveneSomaliSouth AfricanSouth AmericanSouth American IndianSoviet UnionSpaniardSpanishSpanish AmericanSpanish American IndianSri LankanSubsaharan AfricanSudaneseSwedishSwissSyrianTaiwaneseThaiTlingit-HaidaTohono O'OdhamTonganTrinidadian and TobagonianTsimshianTurkishU.S. Virgin IslanderUgandanUkrainianUruguayanUteVenezuelanVietnameseWelshWest IndianYakamaYaquiYugoslavianYumanYup'ikZimbabwean
Immigration
NonimmigrantsImmigrantsAfghanistanAfricaAlbaniaArgentinaArmeniaAsiaAustraliaAustriaBahamasBangladeshBarbadosBelarusBelgiumBelizeBoliviaBosnia and HerzegovinaBrazilBulgariaBurma/MyanmarCabo VerdeCambodiaCameroonCanadaCaribbeanCentral AmericaChileChinaColombiaCongoCosta RicaCubaCzechoslovakiaDenmarkDominicaDominican RepublicEastern AfricaEastern AsiaEastern EuropeEcuadorEgyptEl SalvadorEnglandEritreaEthiopiaEuropeFijiFranceGermanyGhanaGreeceGrenadaGuatemalaGuyanaHaitiHondurasHong KongHungaryIndiaIndonesiaIranIraqIrelandIsraelItalyJamaicaJapanJordanKazakhstanKenyaKoreaKuwaitLaosLatin AmericaLatviaLebanonLiberiaLithuaniaMalaysiaMexicoMicronesiaMiddle AfricaMoldovaMoroccoNepalNetherlandsNicaraguaNigeriaNorth AmericaNorth MacedoniaNorthern AfricaNorthern EuropeNorwayOceaniaPakistanPanamaPeruPhilippinesPolandPortugalRomaniaRussiaSaudi ArabiaScotlandSenegalSerbiaSierra LeoneSingaporeSomaliaSouth AfricaSouth AmericaSouth Central AsiaSouth Eastern AsiaSouthern EuropeSpainSri LankaSt. Vincent and the GrenadinesSudanSwedenSwitzerlandSyriaTaiwanThailandTrinidad and TobagoTurkeyUgandaUkraineUruguayUzbekistanVenezuelaVietnamWest IndiesWestern AfricaWestern AsiaWestern EuropeYemenZaireZimbabweAzores
Immigrants from Croatia
Race
Ancestry
AfghanAfricanAlaska NativeAlaskan AthabascanAlbanianAleutAlsatianAmericanApacheArabArapahoArgentineanArmenianAustralianAustrianBahamianBangladeshiBarbadianBasqueBelgianBelizeanBermudanBhutaneseBlackfeetBolivianBrazilianBritishBritish West IndianBulgarianBurmeseCajunCambodianCanadianCape VerdeanCarpatho RusynCelticCentral AmericanCentral American IndianCherokeeCheyenneChickasawChileanChineseChippewaChoctawColombianColvilleComancheCosta RicanCreeCreekCroatianCrowCubanCypriotCzechCzechoslovakianDanishDelawareDominicanDutchDutch West IndianEastern EuropeanEcuadorianEgyptianEnglishEstonianEthiopianEuropeanFijianFilipinoFinnishFrenchFrench American IndianFrench CanadianGermanGerman RussianGhanaianGreekGuamanian/ChamorroGuatemalanGuyaneseHaitianHmongHonduranHopiHoumaHungarianIcelanderIndian (Asian)IndonesianInupiatIranianIraqiIrishIroquoisIsraeliItalianJamaicanJapaneseJordanianKenyanKiowaKoreanLaotianLatvianLebaneseLiberianLithuanianLumbeeLuxembourgerMacedonianMalaysianMalteseMarshalleseMenomineeMexicanMexican American IndianMongolianMoroccanNative HawaiianNavajoNepaleseNew ZealanderNicaraguanNigerianNorthern EuropeanNorwegianOkinawanOsageOttawaPaiutePakistaniPalestinianPanamanianParaguayanPennsylvania GermanPeruvianPimaPolishPortuguesePotawatomiPuebloPuerto RicanPuget Sound SalishRomanianRussianSalvadoranSamoanScandinavianScotch-IrishScottishSeminoleSenegaleseSerbianShoshoneSierra LeoneanSiouxSlavicSlovakSloveneSomaliSouth AfricanSouth AmericanSouth American IndianSoviet UnionSpaniardSpanishSpanish AmericanSpanish American IndianSri LankanSubsaharan AfricanSudaneseSwedishSwissSyrianTaiwaneseThaiTlingit-HaidaTohono O'OdhamTonganTrinidadian and TobagonianTsimshianTurkishU.S. Virgin IslanderUgandanUkrainianUruguayanUteVenezuelanVietnameseWelshWest IndianYakamaYaquiYugoslavianYumanYup'ikZimbabwean
Immigration
NonimmigrantsImmigrantsAfghanistanAfricaAlbaniaArgentinaArmeniaAsiaAustraliaAustriaBahamasBangladeshBarbadosBelarusBelgiumBelizeBoliviaBosnia and HerzegovinaBrazilBulgariaBurma/MyanmarCabo VerdeCambodiaCameroonCanadaCaribbeanCentral AmericaChileChinaColombiaCongoCosta RicaCroatiaCubaCzechoslovakiaDenmarkDominicaDominican RepublicEastern AfricaEastern AsiaEastern EuropeEcuadorEgyptEl SalvadorEnglandEritreaEthiopiaEuropeFijiFranceGermanyGhanaGreeceGrenadaGuatemalaGuyanaHaitiHondurasHong KongHungaryIndiaIndonesiaIranIraqIrelandIsraelItalyJamaicaJapanJordanKazakhstanKenyaKoreaKuwaitLaosLatin AmericaLatviaLebanonLiberiaLithuaniaMalaysiaMexicoMicronesiaMiddle AfricaMoldovaMoroccoNepalNetherlandsNicaraguaNigeriaNorth AmericaNorth MacedoniaNorthern AfricaNorthern EuropeNorwayOceaniaPakistanPanamaPeruPhilippinesPolandPortugalRomaniaRussiaSaudi ArabiaScotlandSenegalSerbiaSierra LeoneSingaporeSomaliaSouth AfricaSouth AmericaSouth Central AsiaSouth Eastern AsiaSouthern EuropeSpainSri LankaSt. Vincent and the GrenadinesSudanSwedenSwitzerlandSyriaTaiwanThailandTrinidad and TobagoTurkeyUgandaUkraineUruguayUzbekistanVenezuelaVietnamWest IndiesWestern AfricaWestern AsiaWestern EuropeYemenZaireZimbabweAzores
Divorced or Separated
Income
Poverty
Unemployment
Labor Participation
Family Structure
Vehicle Availability
Education Level
Disability

Divorced or Separated Comparison

Assyrians/Chaldeans/Syriacs

Immigrants from Croatia

Exceptional
Exceptional
10.6%
DIVORCED OR SEPARATED
100.0/ 100
METRIC RATING
14th/ 347
METRIC RANK
11.6%
DIVORCED OR SEPARATED
98.3/ 100
METRIC RATING
102nd/ 347
METRIC RANK

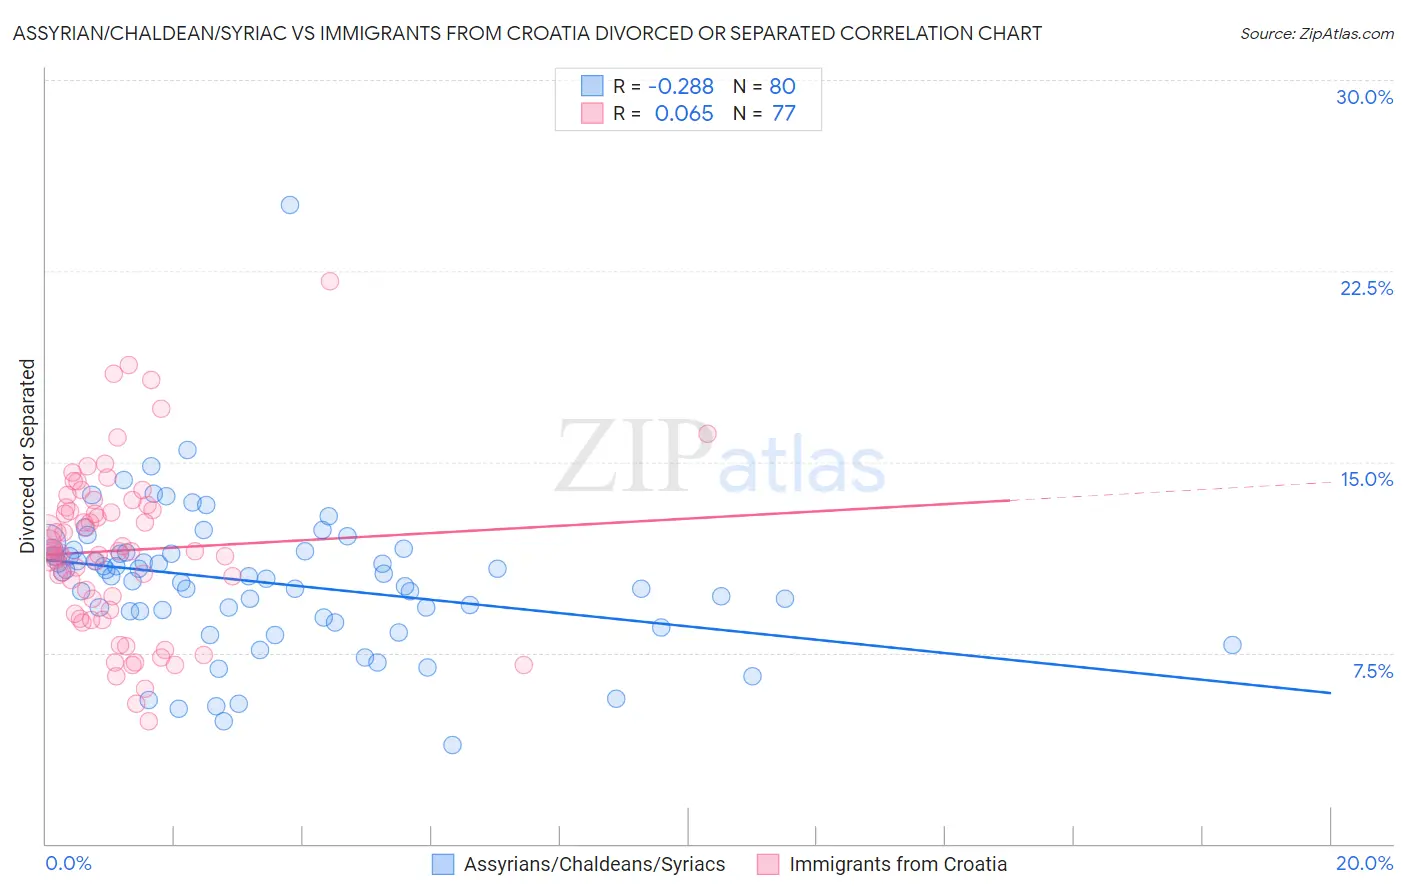
Assyrian/Chaldean/Syriac vs Immigrants from Croatia Divorced or Separated Correlation Chart

The statistical analysis conducted on geographies consisting of 110,313,686 people shows a weak negative correlation between the proportion of Assyrians/Chaldeans/Syriacs and percentage of population currently divorced or separated in the United States with a correlation coefficient (R) of -0.288 and weighted average of 10.6%. Similarly, the statistical analysis conducted on geographies consisting of 132,566,764 people shows a slight positive correlation between the proportion of Immigrants from Croatia and percentage of population currently divorced or separated in the United States with a correlation coefficient (R) of 0.065 and weighted average of 11.6%, a difference of 10.2%.
Assyrian/Chaldean/Syriac vs Immigrants from Croatia Divorced or Separated

Divorced or Separated Correlation Summary

MeasurementAssyrian/Chaldean/SyriacImmigrants from Croatia
Minimum3.9%4.8%
Maximum25.1%22.1%
Range21.2%17.3%
Mean10.3%11.5%
Median10.5%11.5%
Interquartile 25% (IQ1)9.0%9.1%
Interquartile 75% (IQ3)11.5%13.3%
Interquartile Range (IQR)2.5%4.1%
Standard Deviation (Sample)2.9%3.3%
Standard Deviation (Population)2.9%3.2%

Similar Demographics by Divorced or Separated

Demographics Similar to Assyrians/Chaldeans/Syriacs by Divorced or Separated

In terms of divorced or separated, the demographic groups most similar to Assyrians/Chaldeans/Syriacs are Immigrants from Armenia (10.6%, a difference of 0.070%), Immigrants from Korea (10.6%, a difference of 0.51%), Immigrants from Israel (10.6%, a difference of 0.62%), Immigrants from Iran (10.6%, a difference of 0.70%), and Asian (10.6%, a difference of 0.71%).
DemographicsRating | RankDivorced or Separated
Thais
100.0
/100
|
#7
Exceptional
10.2%
Immigrants | Eastern Asia
100.0
/100
|
#8
Exceptional
10.2%
Yup'ik
100.0
/100
|
#9
Exceptional
10.3%
Immigrants | Singapore
100.0
/100
|
#10
Exceptional
10.3%
Immigrants | South Central Asia
100.0
/100
|
#11
Exceptional
10.4%
Okinawans
100.0
/100
|
#12
Exceptional
10.5%
Cypriots
100.0
/100
|
#13
Exceptional
10.5%
Assyrians/Chaldeans/Syriacs
100.0
/100
|
#14
Exceptional
10.6%
Immigrants | Armenia
100.0
/100
|
#15
Exceptional
10.6%
Immigrants | Korea
100.0
/100
|
#16
Exceptional
10.6%
Immigrants | Israel
100.0
/100
|
#17
Exceptional
10.6%
Immigrants | Iran
100.0
/100
|
#18
Exceptional
10.6%
Asians
100.0
/100
|
#19
Exceptional
10.6%
Burmese
100.0
/100
|
#20
Exceptional
10.7%
Immigrants | Asia
100.0
/100
|
#21
Exceptional
10.7%

Demographics Similar to Immigrants from Croatia by Divorced or Separated

In terms of divorced or separated, the demographic groups most similar to Immigrants from Croatia are Maltese (11.6%, a difference of 0.040%), Salvadoran (11.6%, a difference of 0.050%), Immigrants from Guyana (11.6%, a difference of 0.14%), Immigrants from Northern Europe (11.6%, a difference of 0.17%), and Immigrants from El Salvador (11.7%, a difference of 0.18%).
DemographicsRating | RankDivorced or Separated
Immigrants | Serbia
98.8
/100
|
#95
Exceptional
11.6%
Immigrants | Ukraine
98.7
/100
|
#96
Exceptional
11.6%
Latvians
98.7
/100
|
#97
Exceptional
11.6%
Immigrants | Jordan
98.6
/100
|
#98
Exceptional
11.6%
Immigrants | Sweden
98.6
/100
|
#99
Exceptional
11.6%
Immigrants | Northern Europe
98.6
/100
|
#100
Exceptional
11.6%
Immigrants | Guyana
98.5
/100
|
#101
Exceptional
11.6%
Immigrants | Croatia
98.3
/100
|
#102
Exceptional
11.6%
Maltese
98.2
/100
|
#103
Exceptional
11.6%
Salvadorans
98.2
/100
|
#104
Exceptional
11.6%
Immigrants | El Salvador
97.9
/100
|
#105
Exceptional
11.7%
Immigrants | Kazakhstan
97.8
/100
|
#106
Exceptional
11.7%
Native Hawaiians
97.2
/100
|
#107
Exceptional
11.7%
Greeks
96.9
/100
|
#108
Exceptional
11.7%
Immigrants | South Africa
96.9
/100
|
#109
Exceptional
11.7%