Assyrian/Chaldean/Syriac vs Immigrants from Eastern Asia Divorced or Separated
COMPARE
Assyrian/Chaldean/Syriac
Immigrants from Eastern Asia
Divorced or Separated
Divorced or Separated Comparison
Assyrians/Chaldeans/Syriacs
Immigrants from Eastern Asia
10.6%
DIVORCED OR SEPARATED
100.0/ 100
METRIC RATING
14th/ 347
METRIC RANK
10.2%
DIVORCED OR SEPARATED
100.0/ 100
METRIC RATING
8th/ 347
METRIC RANK
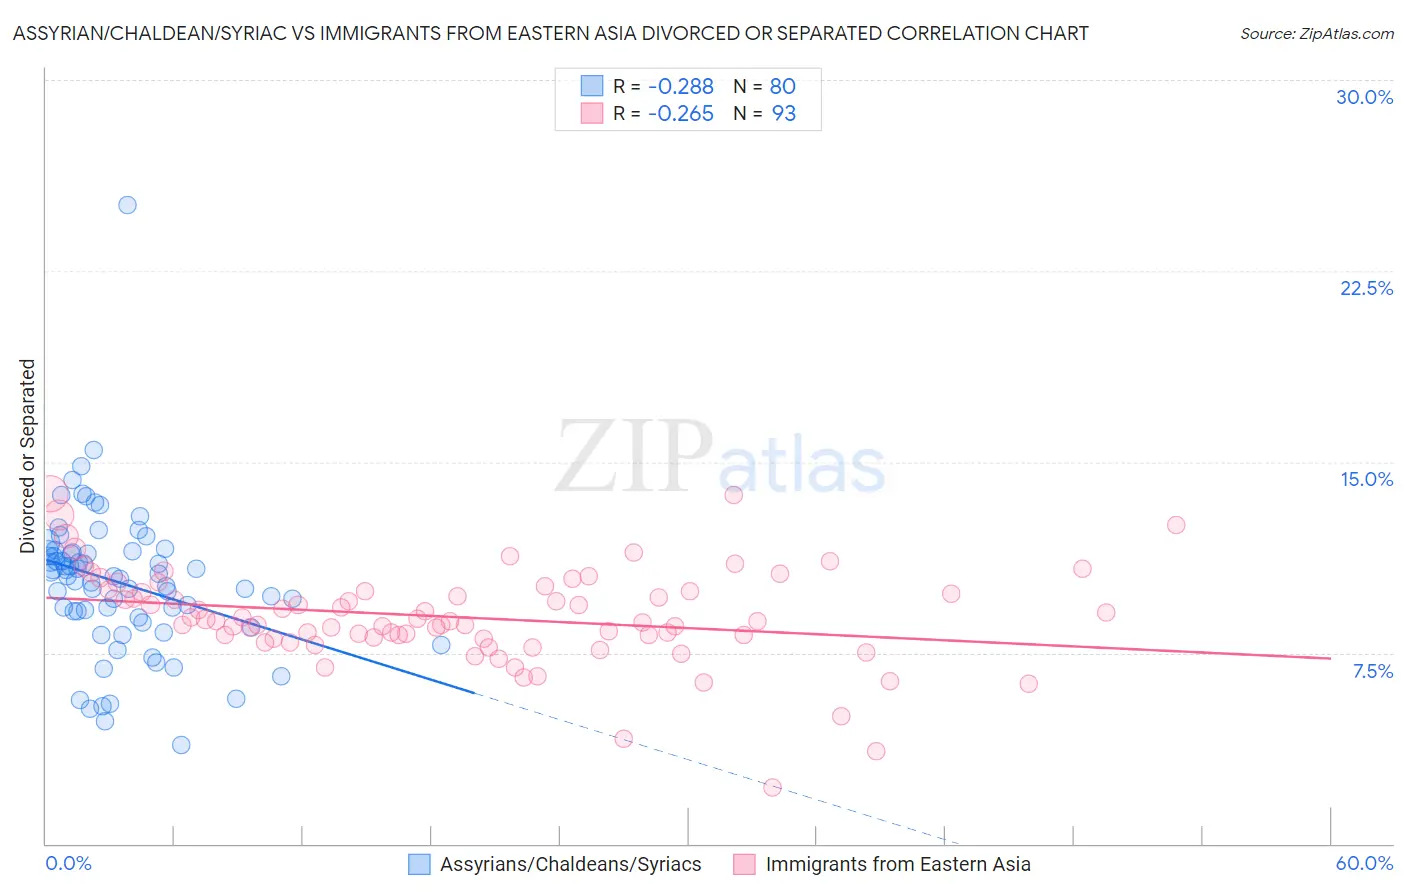
Assyrian/Chaldean/Syriac vs Immigrants from Eastern Asia Divorced or Separated Correlation Chart
The statistical analysis conducted on geographies consisting of 110,313,686 people shows a weak negative correlation between the proportion of Assyrians/Chaldeans/Syriacs and percentage of population currently divorced or separated in the United States with a correlation coefficient (R) of -0.288 and weighted average of 10.6%. Similarly, the statistical analysis conducted on geographies consisting of 499,533,404 people shows a weak negative correlation between the proportion of Immigrants from Eastern Asia and percentage of population currently divorced or separated in the United States with a correlation coefficient (R) of -0.265 and weighted average of 10.2%, a difference of 3.2%.
Divorced or Separated Correlation Summary
| Measurement | Assyrian/Chaldean/Syriac | Immigrants from Eastern Asia |
| Minimum | 3.9% | 2.2% |
| Maximum | 25.1% | 13.7% |
| Range | 21.2% | 11.5% |
| Mean | 10.3% | 8.9% |
| Median | 10.5% | 8.7% |
| Interquartile 25% (IQ1) | 9.0% | 8.1% |
| Interquartile 75% (IQ3) | 11.5% | 9.9% |
| Interquartile Range (IQR) | 2.5% | 1.8% |
| Standard Deviation (Sample) | 2.9% | 1.9% |
| Standard Deviation (Population) | 2.9% | 1.9% |
Demographics Similar to Assyrians/Chaldeans/Syriacs and Immigrants from Eastern Asia by Divorced or Separated
In terms of divorced or separated, the demographic groups most similar to Assyrians/Chaldeans/Syriacs are Immigrants from Armenia (10.6%, a difference of 0.070%), Immigrants from Korea (10.6%, a difference of 0.51%), Immigrants from Israel (10.6%, a difference of 0.62%), Immigrants from Iran (10.6%, a difference of 0.70%), and Asian (10.6%, a difference of 0.71%). Similarly, the demographic groups most similar to Immigrants from Eastern Asia are Thai (10.2%, a difference of 0.34%), Indian (Asian) (10.2%, a difference of 0.39%), Yup'ik (10.3%, a difference of 0.44%), Immigrants from Singapore (10.3%, a difference of 0.97%), and Immigrants from India (10.1%, a difference of 1.7%).
| Demographics | Rating | Rank | Divorced or Separated |
| Immigrants | Taiwan | 100.0 /100 | #1 | Exceptional 9.8% |
| Filipinos | 100.0 /100 | #2 | Exceptional 9.9% |
| Immigrants | Hong Kong | 100.0 /100 | #3 | Exceptional 10.0% |
| Immigrants | China | 100.0 /100 | #4 | Exceptional 10.0% |
| Immigrants | India | 100.0 /100 | #5 | Exceptional 10.1% |
| Indians (Asian) | 100.0 /100 | #6 | Exceptional 10.2% |
| Thais | 100.0 /100 | #7 | Exceptional 10.2% |
| Immigrants | Eastern Asia | 100.0 /100 | #8 | Exceptional 10.2% |
| Yup'ik | 100.0 /100 | #9 | Exceptional 10.3% |
| Immigrants | Singapore | 100.0 /100 | #10 | Exceptional 10.3% |
| Immigrants | South Central Asia | 100.0 /100 | #11 | Exceptional 10.4% |
| Okinawans | 100.0 /100 | #12 | Exceptional 10.5% |
| Cypriots | 100.0 /100 | #13 | Exceptional 10.5% |
| Assyrians/Chaldeans/Syriacs | 100.0 /100 | #14 | Exceptional 10.6% |
| Immigrants | Armenia | 100.0 /100 | #15 | Exceptional 10.6% |
| Immigrants | Korea | 100.0 /100 | #16 | Exceptional 10.6% |
| Immigrants | Israel | 100.0 /100 | #17 | Exceptional 10.6% |
| Immigrants | Iran | 100.0 /100 | #18 | Exceptional 10.6% |
| Asians | 100.0 /100 | #19 | Exceptional 10.6% |
| Burmese | 100.0 /100 | #20 | Exceptional 10.7% |
| Immigrants | Asia | 100.0 /100 | #21 | Exceptional 10.7% |