Assyrian/Chaldean/Syriac vs Spanish 2nd Grade
COMPARE
Assyrian/Chaldean/Syriac
Spanish
2nd Grade
2nd Grade Comparison
Assyrians/Chaldeans/Syriacs
Spanish
97.5%
2ND GRADE
0.5/ 100
METRIC RATING
260th/ 347
METRIC RANK
98.1%
2ND GRADE
95.8/ 100
METRIC RATING
116th/ 347
METRIC RANK
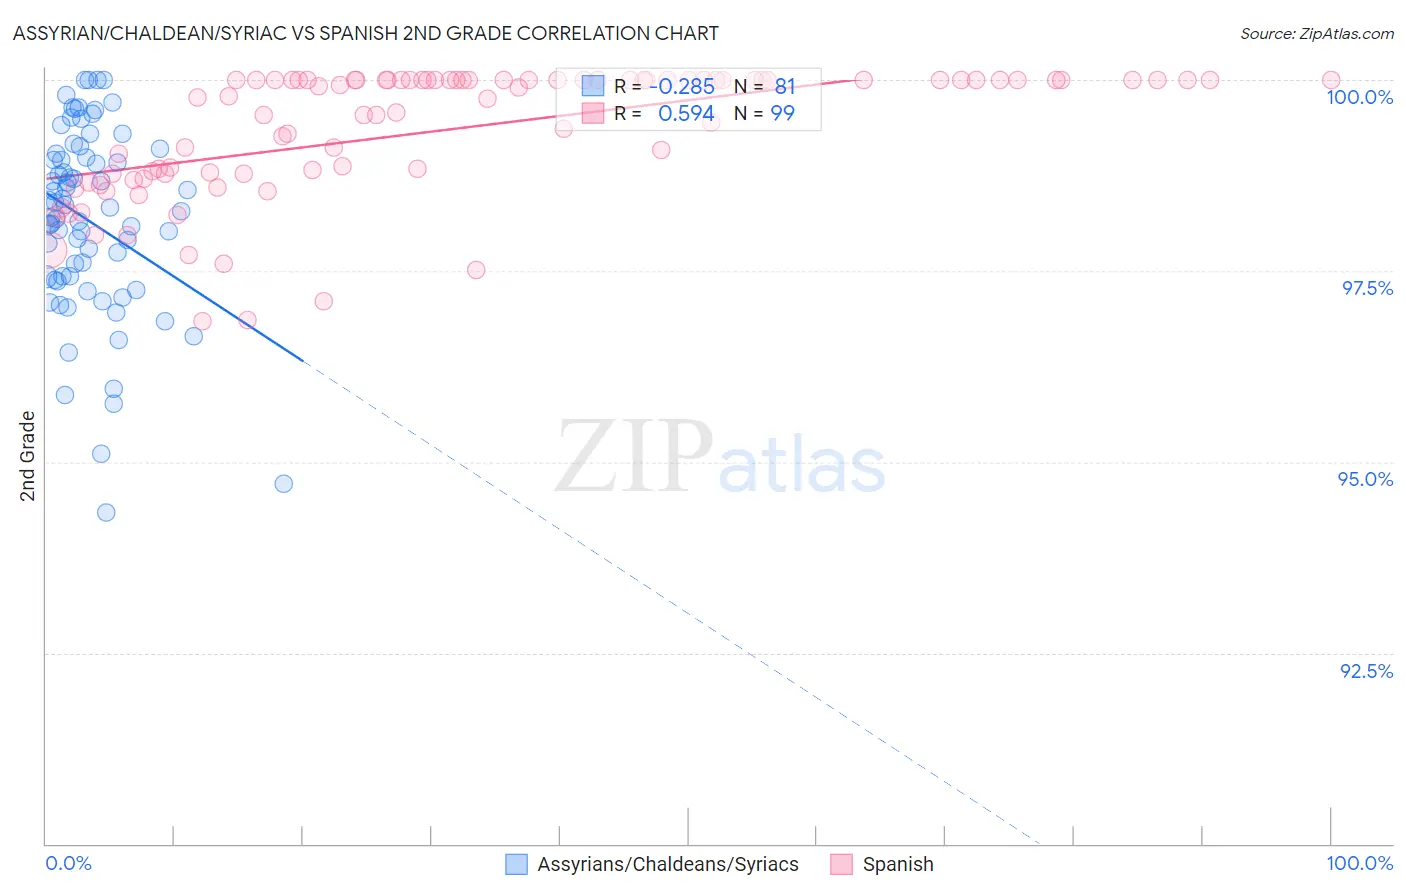
Assyrian/Chaldean/Syriac vs Spanish 2nd Grade Correlation Chart
The statistical analysis conducted on geographies consisting of 110,318,304 people shows a weak negative correlation between the proportion of Assyrians/Chaldeans/Syriacs and percentage of population with at least 2nd grade education in the United States with a correlation coefficient (R) of -0.285 and weighted average of 97.5%. Similarly, the statistical analysis conducted on geographies consisting of 422,189,210 people shows a substantial positive correlation between the proportion of Spanish and percentage of population with at least 2nd grade education in the United States with a correlation coefficient (R) of 0.594 and weighted average of 98.1%, a difference of 0.67%.
2nd Grade Correlation Summary
| Measurement | Assyrian/Chaldean/Syriac | Spanish |
| Minimum | 94.3% | 96.8% |
| Maximum | 100.0% | 100.0% |
| Range | 5.7% | 3.2% |
| Mean | 98.2% | 99.3% |
| Median | 98.3% | 99.9% |
| Interquartile 25% (IQ1) | 97.4% | 98.8% |
| Interquartile 75% (IQ3) | 99.0% | 100.0% |
| Interquartile Range (IQR) | 1.6% | 1.2% |
| Standard Deviation (Sample) | 1.2% | 0.84% |
| Standard Deviation (Population) | 1.2% | 0.84% |
Similar Demographics by 2nd Grade
Demographics Similar to Assyrians/Chaldeans/Syriacs by 2nd Grade
In terms of 2nd grade, the demographic groups most similar to Assyrians/Chaldeans/Syriacs are Fijian (97.5%, a difference of 0.0%), Armenian (97.5%, a difference of 0.0%), Immigrants from Colombia (97.5%, a difference of 0.010%), Yaqui (97.5%, a difference of 0.010%), and Taiwanese (97.4%, a difference of 0.010%).
| Demographics | Rating | Rank | 2nd Grade |
| Puerto Ricans | 0.7 /100 | #253 | Tragic 97.5% |
| Indians (Asian) | 0.6 /100 | #254 | Tragic 97.5% |
| Immigrants | Congo | 0.6 /100 | #255 | Tragic 97.5% |
| Jamaicans | 0.6 /100 | #256 | Tragic 97.5% |
| Immigrants | Colombia | 0.5 /100 | #257 | Tragic 97.5% |
| Yaqui | 0.5 /100 | #258 | Tragic 97.5% |
| Fijians | 0.5 /100 | #259 | Tragic 97.5% |
| Assyrians/Chaldeans/Syriacs | 0.5 /100 | #260 | Tragic 97.5% |
| Armenians | 0.5 /100 | #261 | Tragic 97.5% |
| Taiwanese | 0.4 /100 | #262 | Tragic 97.4% |
| Immigrants | Ethiopia | 0.4 /100 | #263 | Tragic 97.4% |
| Immigrants | Liberia | 0.4 /100 | #264 | Tragic 97.4% |
| Immigrants | South America | 0.4 /100 | #265 | Tragic 97.4% |
| Immigrants | Sierra Leone | 0.4 /100 | #266 | Tragic 97.4% |
| Cubans | 0.3 /100 | #267 | Tragic 97.4% |
Demographics Similar to Spanish by 2nd Grade
In terms of 2nd grade, the demographic groups most similar to Spanish are Iranian (98.1%, a difference of 0.0%), Ute (98.1%, a difference of 0.0%), Immigrants from France (98.1%, a difference of 0.0%), Immigrants from Latvia (98.1%, a difference of 0.010%), and Thai (98.1%, a difference of 0.010%).
| Demographics | Rating | Rank | 2nd Grade |
| Basques | 97.2 /100 | #109 | Exceptional 98.1% |
| Immigrants | Singapore | 97.0 /100 | #110 | Exceptional 98.1% |
| Immigrants | Czechoslovakia | 96.9 /100 | #111 | Exceptional 98.1% |
| Colville | 96.6 /100 | #112 | Exceptional 98.1% |
| Immigrants | Norway | 96.5 /100 | #113 | Exceptional 98.1% |
| Immigrants | Latvia | 96.4 /100 | #114 | Exceptional 98.1% |
| Iranians | 95.9 /100 | #115 | Exceptional 98.1% |
| Spanish | 95.8 /100 | #116 | Exceptional 98.1% |
| Ute | 95.7 /100 | #117 | Exceptional 98.1% |
| Immigrants | France | 95.6 /100 | #118 | Exceptional 98.1% |
| Thais | 95.3 /100 | #119 | Exceptional 98.1% |
| Okinawans | 94.9 /100 | #120 | Exceptional 98.1% |
| Immigrants | Zimbabwe | 94.4 /100 | #121 | Exceptional 98.1% |
| Lebanese | 94.2 /100 | #122 | Exceptional 98.1% |
| Immigrants | Japan | 94.1 /100 | #123 | Exceptional 98.1% |