Assyrian/Chaldean/Syriac vs Immigrants from Lebanon Divorced or Separated
COMPARE
Assyrian/Chaldean/Syriac
Immigrants from Lebanon
Divorced or Separated
Divorced or Separated Comparison
Assyrians/Chaldeans/Syriacs
Immigrants from Lebanon
10.6%
DIVORCED OR SEPARATED
100.0/ 100
METRIC RATING
14th/ 347
METRIC RANK
11.1%
DIVORCED OR SEPARATED
100.0/ 100
METRIC RATING
37th/ 347
METRIC RANK
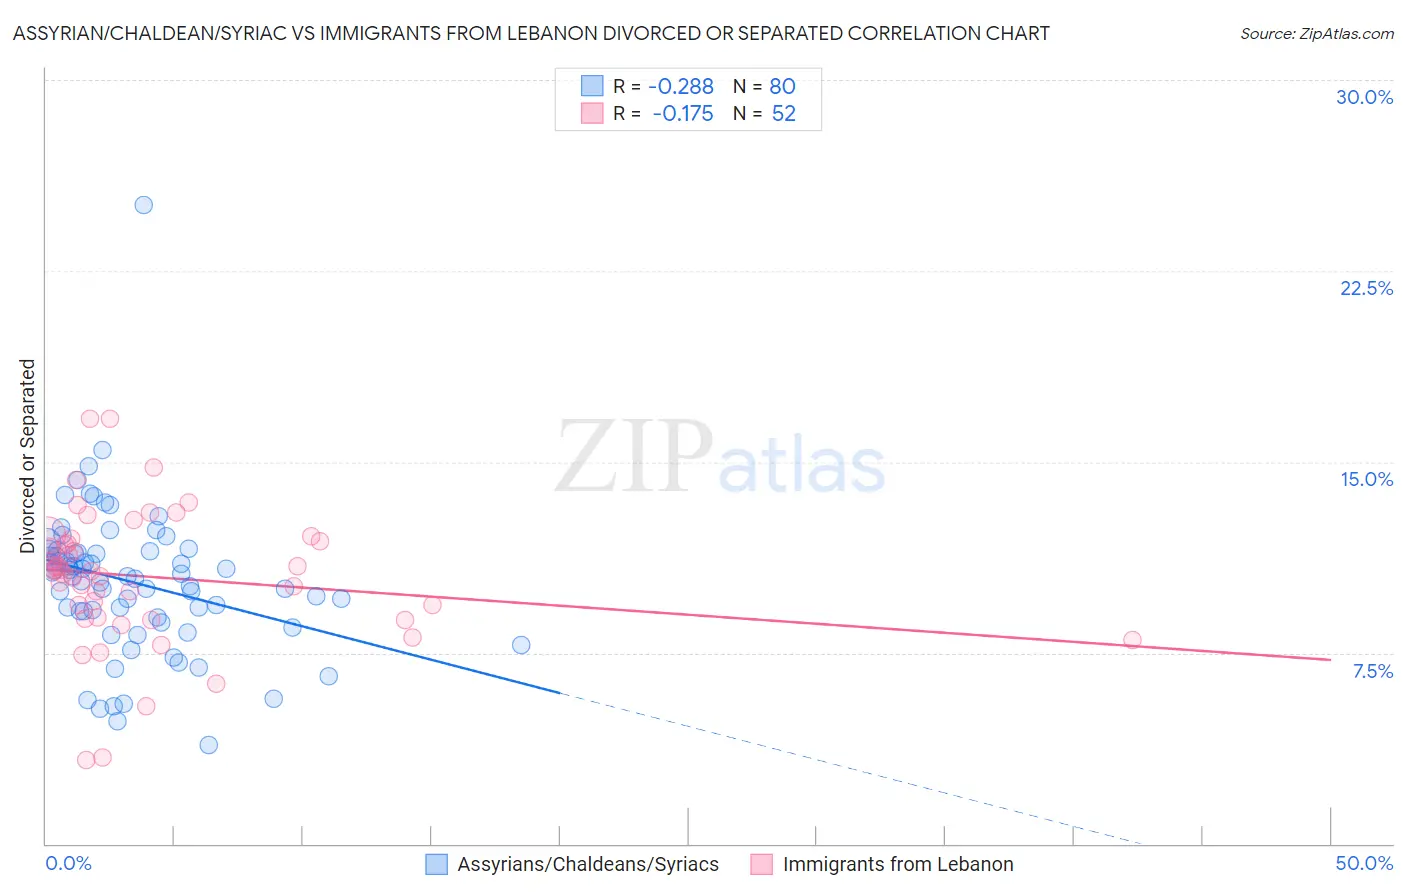
Assyrian/Chaldean/Syriac vs Immigrants from Lebanon Divorced or Separated Correlation Chart
The statistical analysis conducted on geographies consisting of 110,313,686 people shows a weak negative correlation between the proportion of Assyrians/Chaldeans/Syriacs and percentage of population currently divorced or separated in the United States with a correlation coefficient (R) of -0.288 and weighted average of 10.6%. Similarly, the statistical analysis conducted on geographies consisting of 217,122,849 people shows a poor negative correlation between the proportion of Immigrants from Lebanon and percentage of population currently divorced or separated in the United States with a correlation coefficient (R) of -0.175 and weighted average of 11.1%, a difference of 5.1%.
Divorced or Separated Correlation Summary
| Measurement | Assyrian/Chaldean/Syriac | Immigrants from Lebanon |
| Minimum | 3.9% | 3.3% |
| Maximum | 25.1% | 16.7% |
| Range | 21.2% | 13.4% |
| Mean | 10.3% | 10.5% |
| Median | 10.5% | 10.7% |
| Interquartile 25% (IQ1) | 9.0% | 8.9% |
| Interquartile 75% (IQ3) | 11.5% | 11.9% |
| Interquartile Range (IQR) | 2.5% | 3.1% |
| Standard Deviation (Sample) | 2.9% | 2.7% |
| Standard Deviation (Population) | 2.9% | 2.7% |
Similar Demographics by Divorced or Separated
Demographics Similar to Assyrians/Chaldeans/Syriacs by Divorced or Separated
In terms of divorced or separated, the demographic groups most similar to Assyrians/Chaldeans/Syriacs are Immigrants from Armenia (10.6%, a difference of 0.070%), Immigrants from Korea (10.6%, a difference of 0.51%), Immigrants from Israel (10.6%, a difference of 0.62%), Immigrants from Iran (10.6%, a difference of 0.70%), and Asian (10.6%, a difference of 0.71%).
| Demographics | Rating | Rank | Divorced or Separated |
| Thais | 100.0 /100 | #7 | Exceptional 10.2% |
| Immigrants | Eastern Asia | 100.0 /100 | #8 | Exceptional 10.2% |
| Yup'ik | 100.0 /100 | #9 | Exceptional 10.3% |
| Immigrants | Singapore | 100.0 /100 | #10 | Exceptional 10.3% |
| Immigrants | South Central Asia | 100.0 /100 | #11 | Exceptional 10.4% |
| Okinawans | 100.0 /100 | #12 | Exceptional 10.5% |
| Cypriots | 100.0 /100 | #13 | Exceptional 10.5% |
| Assyrians/Chaldeans/Syriacs | 100.0 /100 | #14 | Exceptional 10.6% |
| Immigrants | Armenia | 100.0 /100 | #15 | Exceptional 10.6% |
| Immigrants | Korea | 100.0 /100 | #16 | Exceptional 10.6% |
| Immigrants | Israel | 100.0 /100 | #17 | Exceptional 10.6% |
| Immigrants | Iran | 100.0 /100 | #18 | Exceptional 10.6% |
| Asians | 100.0 /100 | #19 | Exceptional 10.6% |
| Burmese | 100.0 /100 | #20 | Exceptional 10.7% |
| Immigrants | Asia | 100.0 /100 | #21 | Exceptional 10.7% |
Demographics Similar to Immigrants from Lebanon by Divorced or Separated
In terms of divorced or separated, the demographic groups most similar to Immigrants from Lebanon are Immigrants from Japan (11.1%, a difference of 0.010%), Immigrants from Greece (11.1%, a difference of 0.060%), Cambodian (11.1%, a difference of 0.070%), Immigrants from Uzbekistan (11.1%, a difference of 0.15%), and Egyptian (11.1%, a difference of 0.22%).
| Demographics | Rating | Rank | Divorced or Separated |
| Immigrants | Ireland | 100.0 /100 | #30 | Exceptional 11.0% |
| Mongolians | 100.0 /100 | #31 | Exceptional 11.1% |
| Tongans | 100.0 /100 | #32 | Exceptional 11.1% |
| Egyptians | 100.0 /100 | #33 | Exceptional 11.1% |
| Immigrants | Uzbekistan | 100.0 /100 | #34 | Exceptional 11.1% |
| Cambodians | 100.0 /100 | #35 | Exceptional 11.1% |
| Immigrants | Japan | 100.0 /100 | #36 | Exceptional 11.1% |
| Immigrants | Lebanon | 100.0 /100 | #37 | Exceptional 11.1% |
| Immigrants | Greece | 100.0 /100 | #38 | Exceptional 11.1% |
| Immigrants | Egypt | 100.0 /100 | #39 | Exceptional 11.1% |
| Soviet Union | 100.0 /100 | #40 | Exceptional 11.1% |
| Bhutanese | 100.0 /100 | #41 | Exceptional 11.2% |
| Chinese | 100.0 /100 | #42 | Exceptional 11.2% |
| Immigrants | Belarus | 100.0 /100 | #43 | Exceptional 11.2% |
| Immigrants | Western Asia | 100.0 /100 | #44 | Exceptional 11.2% |