Syrian vs Spanish Divorced or Separated
COMPARE
Syrian
Spanish
Divorced or Separated
Divorced or Separated Comparison
Syrians
Spanish
11.7%
DIVORCED OR SEPARATED
95.1/ 100
METRIC RATING
119th/ 347
METRIC RANK
12.8%
DIVORCED OR SEPARATED
0.1/ 100
METRIC RATING
286th/ 347
METRIC RANK
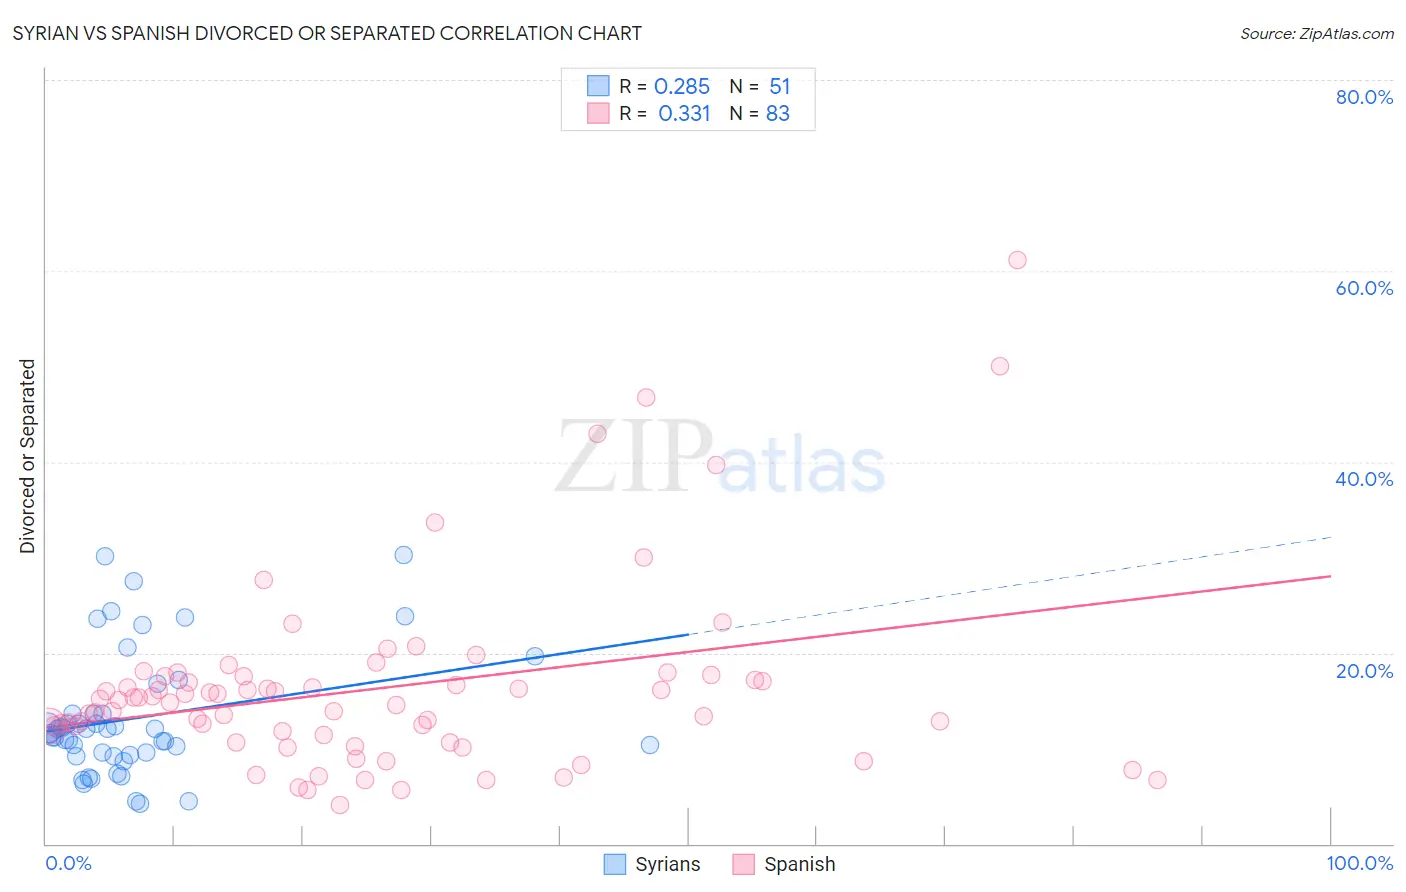
Syrian vs Spanish Divorced or Separated Correlation Chart
The statistical analysis conducted on geographies consisting of 266,220,944 people shows a weak positive correlation between the proportion of Syrians and percentage of population currently divorced or separated in the United States with a correlation coefficient (R) of 0.285 and weighted average of 11.7%. Similarly, the statistical analysis conducted on geographies consisting of 422,013,877 people shows a mild positive correlation between the proportion of Spanish and percentage of population currently divorced or separated in the United States with a correlation coefficient (R) of 0.331 and weighted average of 12.8%, a difference of 8.8%.
Divorced or Separated Correlation Summary
| Measurement | Syrian | Spanish |
| Minimum | 4.2% | 4.0% |
| Maximum | 30.2% | 61.2% |
| Range | 26.0% | 57.2% |
| Mean | 13.2% | 16.3% |
| Median | 12.0% | 15.1% |
| Interquartile 25% (IQ1) | 9.3% | 11.4% |
| Interquartile 75% (IQ3) | 13.6% | 17.6% |
| Interquartile Range (IQR) | 4.4% | 6.1% |
| Standard Deviation (Sample) | 6.5% | 9.8% |
| Standard Deviation (Population) | 6.4% | 9.7% |
Similar Demographics by Divorced or Separated
Demographics Similar to Syrians by Divorced or Separated
In terms of divorced or separated, the demographic groups most similar to Syrians are Ecuadorian (11.7%, a difference of 0.040%), Immigrants from Uganda (11.7%, a difference of 0.050%), Immigrants from Iraq (11.7%, a difference of 0.060%), Iraqi (11.8%, a difference of 0.090%), and Romanian (11.8%, a difference of 0.10%).
| Demographics | Rating | Rank | Divorced or Separated |
| Immigrants | France | 96.6 /100 | #112 | Exceptional 11.7% |
| Estonians | 96.6 /100 | #113 | Exceptional 11.7% |
| Immigrants | Norway | 95.9 /100 | #114 | Exceptional 11.7% |
| Lithuanians | 95.7 /100 | #115 | Exceptional 11.7% |
| Immigrants | Iraq | 95.4 /100 | #116 | Exceptional 11.7% |
| Immigrants | Uganda | 95.3 /100 | #117 | Exceptional 11.7% |
| Ecuadorians | 95.3 /100 | #118 | Exceptional 11.7% |
| Syrians | 95.1 /100 | #119 | Exceptional 11.7% |
| Iraqis | 94.6 /100 | #120 | Exceptional 11.8% |
| Romanians | 94.5 /100 | #121 | Exceptional 11.8% |
| Menominee | 93.8 /100 | #122 | Exceptional 11.8% |
| Immigrants | Immigrants | 93.7 /100 | #123 | Exceptional 11.8% |
| Ugandans | 93.1 /100 | #124 | Exceptional 11.8% |
| Ukrainians | 92.3 /100 | #125 | Exceptional 11.8% |
| South American Indians | 92.1 /100 | #126 | Exceptional 11.8% |
Demographics Similar to Spanish by Divorced or Separated
In terms of divorced or separated, the demographic groups most similar to Spanish are Honduran (12.8%, a difference of 0.19%), French (12.8%, a difference of 0.23%), Nonimmigrants (12.8%, a difference of 0.26%), Delaware (12.7%, a difference of 0.35%), and Subsaharan African (12.7%, a difference of 0.36%).
| Demographics | Rating | Rank | Divorced or Separated |
| Immigrants | Dominican Republic | 0.2 /100 | #279 | Tragic 12.7% |
| Immigrants | Zaire | 0.2 /100 | #280 | Tragic 12.7% |
| Pueblo | 0.2 /100 | #281 | Tragic 12.7% |
| Sub-Saharan Africans | 0.1 /100 | #282 | Tragic 12.7% |
| Delaware | 0.1 /100 | #283 | Tragic 12.7% |
| Immigrants | Nonimmigrants | 0.1 /100 | #284 | Tragic 12.8% |
| French | 0.1 /100 | #285 | Tragic 12.8% |
| Spanish | 0.1 /100 | #286 | Tragic 12.8% |
| Hondurans | 0.1 /100 | #287 | Tragic 12.8% |
| French Canadians | 0.1 /100 | #288 | Tragic 12.8% |
| Iroquois | 0.0 /100 | #289 | Tragic 12.9% |
| Pima | 0.0 /100 | #290 | Tragic 12.9% |
| Immigrants | Honduras | 0.0 /100 | #291 | Tragic 12.9% |
| Scotch-Irish | 0.0 /100 | #292 | Tragic 12.9% |
| Jamaicans | 0.0 /100 | #293 | Tragic 12.9% |