Assyrian/Chaldean/Syriac vs Immigrants from Bulgaria Divorced or Separated
COMPARE
Assyrian/Chaldean/Syriac
Immigrants from Bulgaria
Divorced or Separated
Divorced or Separated Comparison
Assyrians/Chaldeans/Syriacs
Immigrants from Bulgaria
10.6%
DIVORCED OR SEPARATED
100.0/ 100
METRIC RATING
14th/ 347
METRIC RANK
11.5%
DIVORCED OR SEPARATED
99.3/ 100
METRIC RATING
83rd/ 347
METRIC RANK
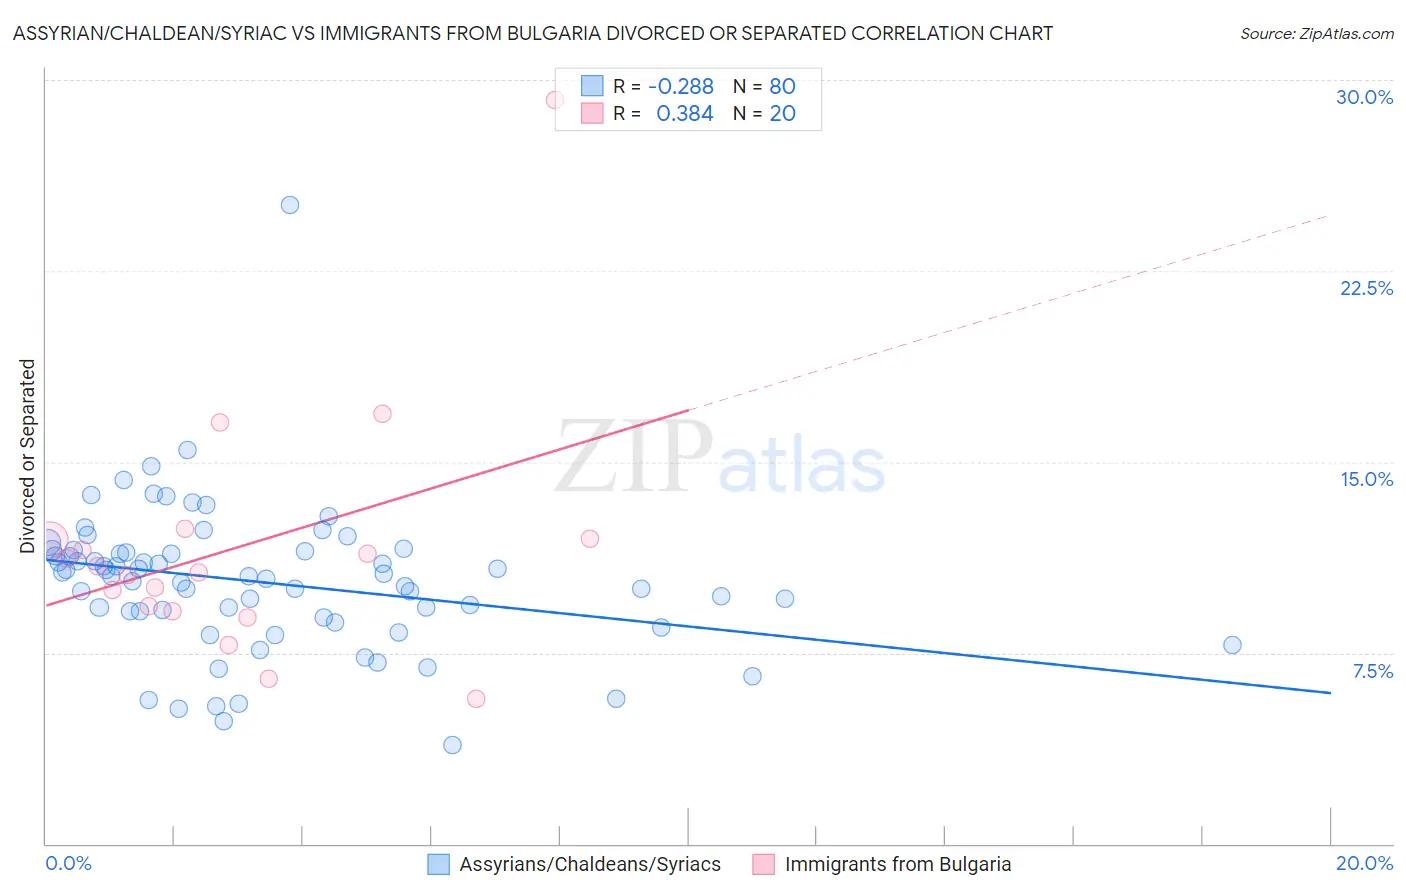
Assyrian/Chaldean/Syriac vs Immigrants from Bulgaria Divorced or Separated Correlation Chart
The statistical analysis conducted on geographies consisting of 110,313,686 people shows a weak negative correlation between the proportion of Assyrians/Chaldeans/Syriacs and percentage of population currently divorced or separated in the United States with a correlation coefficient (R) of -0.288 and weighted average of 10.6%. Similarly, the statistical analysis conducted on geographies consisting of 172,542,823 people shows a mild positive correlation between the proportion of Immigrants from Bulgaria and percentage of population currently divorced or separated in the United States with a correlation coefficient (R) of 0.384 and weighted average of 11.5%, a difference of 9.2%.
Divorced or Separated Correlation Summary
| Measurement | Assyrian/Chaldean/Syriac | Immigrants from Bulgaria |
| Minimum | 3.9% | 5.7% |
| Maximum | 25.1% | 29.2% |
| Range | 21.2% | 23.5% |
| Mean | 10.3% | 11.6% |
| Median | 10.5% | 10.8% |
| Interquartile 25% (IQ1) | 9.0% | 9.2% |
| Interquartile 75% (IQ3) | 11.5% | 12.0% |
| Interquartile Range (IQR) | 2.5% | 2.7% |
| Standard Deviation (Sample) | 2.9% | 4.9% |
| Standard Deviation (Population) | 2.9% | 4.8% |
Similar Demographics by Divorced or Separated
Demographics Similar to Assyrians/Chaldeans/Syriacs by Divorced or Separated
In terms of divorced or separated, the demographic groups most similar to Assyrians/Chaldeans/Syriacs are Immigrants from Armenia (10.6%, a difference of 0.070%), Immigrants from Korea (10.6%, a difference of 0.51%), Immigrants from Israel (10.6%, a difference of 0.62%), Immigrants from Iran (10.6%, a difference of 0.70%), and Asian (10.6%, a difference of 0.71%).
| Demographics | Rating | Rank | Divorced or Separated |
| Thais | 100.0 /100 | #7 | Exceptional 10.2% |
| Immigrants | Eastern Asia | 100.0 /100 | #8 | Exceptional 10.2% |
| Yup'ik | 100.0 /100 | #9 | Exceptional 10.3% |
| Immigrants | Singapore | 100.0 /100 | #10 | Exceptional 10.3% |
| Immigrants | South Central Asia | 100.0 /100 | #11 | Exceptional 10.4% |
| Okinawans | 100.0 /100 | #12 | Exceptional 10.5% |
| Cypriots | 100.0 /100 | #13 | Exceptional 10.5% |
| Assyrians/Chaldeans/Syriacs | 100.0 /100 | #14 | Exceptional 10.6% |
| Immigrants | Armenia | 100.0 /100 | #15 | Exceptional 10.6% |
| Immigrants | Korea | 100.0 /100 | #16 | Exceptional 10.6% |
| Immigrants | Israel | 100.0 /100 | #17 | Exceptional 10.6% |
| Immigrants | Iran | 100.0 /100 | #18 | Exceptional 10.6% |
| Asians | 100.0 /100 | #19 | Exceptional 10.6% |
| Burmese | 100.0 /100 | #20 | Exceptional 10.7% |
| Immigrants | Asia | 100.0 /100 | #21 | Exceptional 10.7% |
Demographics Similar to Immigrants from Bulgaria by Divorced or Separated
In terms of divorced or separated, the demographic groups most similar to Immigrants from Bulgaria are Bulgarian (11.5%, a difference of 0.020%), Immigrants from Romania (11.5%, a difference of 0.030%), Immigrants from Albania (11.5%, a difference of 0.080%), Russian (11.5%, a difference of 0.11%), and Immigrants from Switzerland (11.5%, a difference of 0.12%).
| Demographics | Rating | Rank | Divorced or Separated |
| Albanians | 99.6 /100 | #76 | Exceptional 11.5% |
| Immigrants | Italy | 99.5 /100 | #77 | Exceptional 11.5% |
| Afghans | 99.4 /100 | #78 | Exceptional 11.5% |
| Guyanese | 99.4 /100 | #79 | Exceptional 11.5% |
| Immigrants | Switzerland | 99.4 /100 | #80 | Exceptional 11.5% |
| Russians | 99.4 /100 | #81 | Exceptional 11.5% |
| Immigrants | Romania | 99.3 /100 | #82 | Exceptional 11.5% |
| Immigrants | Bulgaria | 99.3 /100 | #83 | Exceptional 11.5% |
| Bulgarians | 99.3 /100 | #84 | Exceptional 11.5% |
| Immigrants | Albania | 99.3 /100 | #85 | Exceptional 11.5% |
| Immigrants | Latvia | 99.2 /100 | #86 | Exceptional 11.6% |
| Immigrants | Nepal | 99.2 /100 | #87 | Exceptional 11.6% |
| Immigrants | Europe | 99.2 /100 | #88 | Exceptional 11.6% |
| Immigrants | Southern Europe | 99.1 /100 | #89 | Exceptional 11.6% |
| Zimbabweans | 99.0 /100 | #90 | Exceptional 11.6% |