Scotch-Irish vs Immigrants from Korea Single Father Households
COMPARE
Scotch-Irish
Immigrants from Korea
Single Father Households
Single Father Households Comparison
Scotch-Irish
Immigrants from Korea
2.3%
SINGLE FATHER HOUSEHOLDS
69.4/ 100
METRIC RATING
165th/ 347
METRIC RANK
2.0%
SINGLE FATHER HOUSEHOLDS
99.9/ 100
METRIC RATING
54th/ 347
METRIC RANK
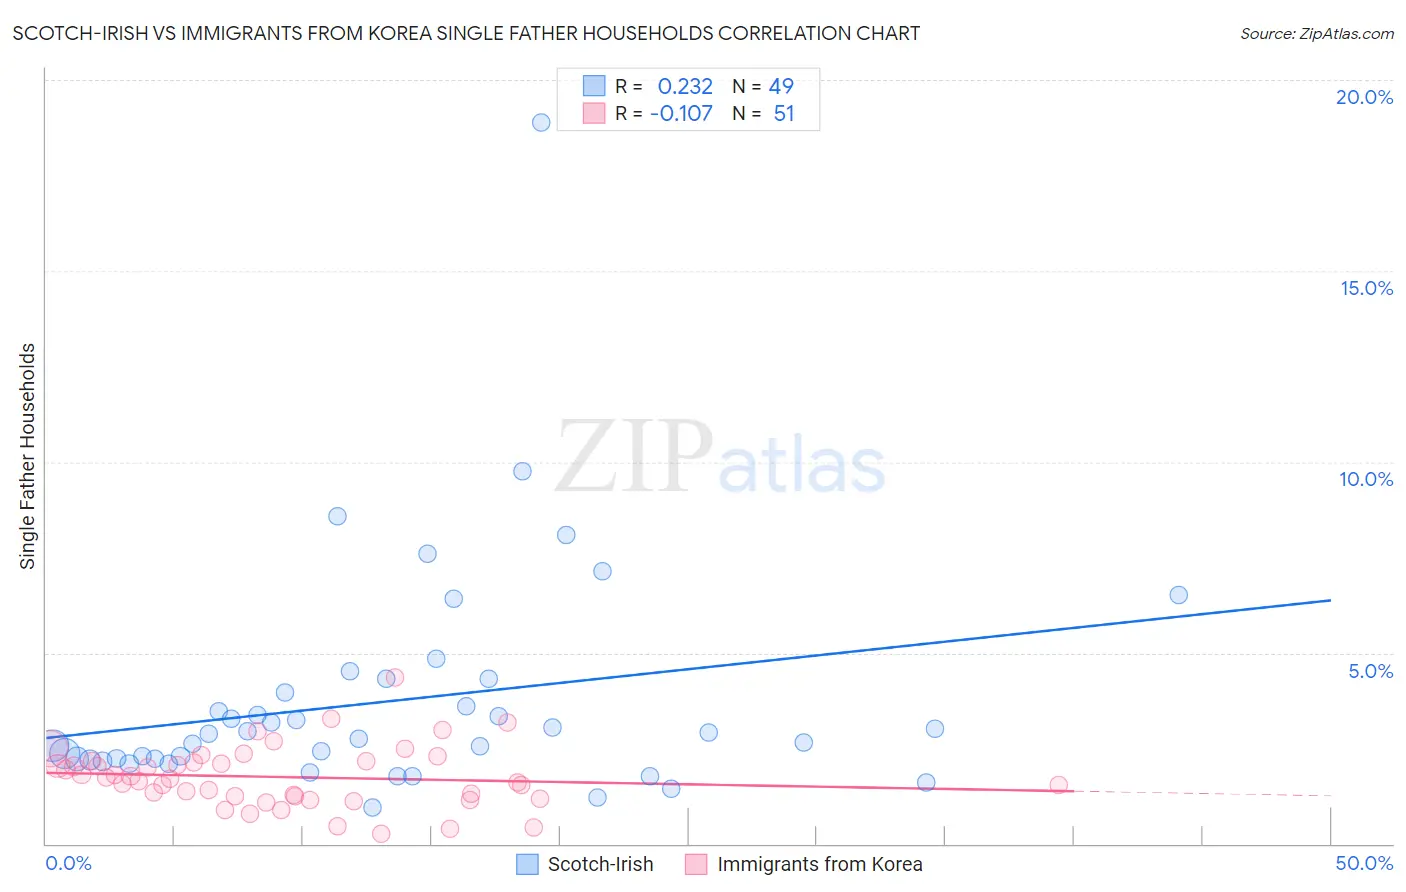
Scotch-Irish vs Immigrants from Korea Single Father Households Correlation Chart
The statistical analysis conducted on geographies consisting of 535,957,408 people shows a weak positive correlation between the proportion of Scotch-Irish and percentage of single father households in the United States with a correlation coefficient (R) of 0.232 and weighted average of 2.3%. Similarly, the statistical analysis conducted on geographies consisting of 412,362,512 people shows a poor negative correlation between the proportion of Immigrants from Korea and percentage of single father households in the United States with a correlation coefficient (R) of -0.107 and weighted average of 2.0%, a difference of 13.6%.
Single Father Households Correlation Summary
| Measurement | Scotch-Irish | Immigrants from Korea |
| Minimum | 0.96% | 0.27% |
| Maximum | 18.9% | 4.4% |
| Range | 17.9% | 4.1% |
| Mean | 3.7% | 1.7% |
| Median | 2.9% | 1.7% |
| Interquartile 25% (IQ1) | 2.2% | 1.2% |
| Interquartile 75% (IQ3) | 4.1% | 2.1% |
| Interquartile Range (IQR) | 1.9% | 0.91% |
| Standard Deviation (Sample) | 3.0% | 0.80% |
| Standard Deviation (Population) | 3.0% | 0.79% |
Similar Demographics by Single Father Households
Demographics Similar to Scotch-Irish by Single Father Households
In terms of single father households, the demographic groups most similar to Scotch-Irish are English (2.3%, a difference of 0.070%), Pakistani (2.3%, a difference of 0.10%), Irish (2.3%, a difference of 0.24%), Scottish (2.3%, a difference of 0.31%), and Swiss (2.3%, a difference of 0.35%).
| Demographics | Rating | Rank | Single Father Households |
| Immigrants | Senegal | 79.4 /100 | #158 | Good 2.3% |
| Immigrants | West Indies | 77.9 /100 | #159 | Good 2.3% |
| Immigrants | Bolivia | 76.3 /100 | #160 | Good 2.3% |
| Swiss | 73.2 /100 | #161 | Good 2.3% |
| Scottish | 72.8 /100 | #162 | Good 2.3% |
| Irish | 72.1 /100 | #163 | Good 2.3% |
| Pakistanis | 70.6 /100 | #164 | Good 2.3% |
| Scotch-Irish | 69.4 /100 | #165 | Good 2.3% |
| English | 68.6 /100 | #166 | Good 2.3% |
| South Americans | 64.3 /100 | #167 | Good 2.3% |
| Icelanders | 63.1 /100 | #168 | Good 2.3% |
| Czechs | 62.5 /100 | #169 | Good 2.3% |
| Ugandans | 62.2 /100 | #170 | Good 2.3% |
| Swedes | 61.6 /100 | #171 | Good 2.3% |
| Czechoslovakians | 58.9 /100 | #172 | Average 2.3% |
Demographics Similar to Immigrants from Korea by Single Father Households
In terms of single father households, the demographic groups most similar to Immigrants from Korea are Immigrants from France (2.0%, a difference of 0.050%), Immigrants from Norway (2.0%, a difference of 0.080%), Immigrants from Northern Europe (2.0%, a difference of 0.14%), Immigrants from Europe (2.0%, a difference of 0.28%), and Burmese (2.0%, a difference of 0.34%).
| Demographics | Rating | Rank | Single Father Households |
| Immigrants | Ukraine | 99.9 /100 | #47 | Exceptional 2.0% |
| Immigrants | Kazakhstan | 99.9 /100 | #48 | Exceptional 2.0% |
| Immigrants | Serbia | 99.9 /100 | #49 | Exceptional 2.0% |
| Immigrants | Switzerland | 99.9 /100 | #50 | Exceptional 2.0% |
| Immigrants | Poland | 99.9 /100 | #51 | Exceptional 2.0% |
| Immigrants | Europe | 99.9 /100 | #52 | Exceptional 2.0% |
| Immigrants | Northern Europe | 99.9 /100 | #53 | Exceptional 2.0% |
| Immigrants | Korea | 99.9 /100 | #54 | Exceptional 2.0% |
| Immigrants | France | 99.9 /100 | #55 | Exceptional 2.0% |
| Immigrants | Norway | 99.9 /100 | #56 | Exceptional 2.0% |
| Burmese | 99.9 /100 | #57 | Exceptional 2.0% |
| Immigrants | Czechoslovakia | 99.9 /100 | #58 | Exceptional 2.0% |
| Immigrants | North Macedonia | 99.9 /100 | #59 | Exceptional 2.0% |
| Immigrants | Austria | 99.9 /100 | #60 | Exceptional 2.0% |
| Vietnamese | 99.9 /100 | #61 | Exceptional 2.0% |