Danish vs Immigrants from Korea Single Father Households
COMPARE
Danish
Immigrants from Korea
Single Father Households
Single Father Households Comparison
Danes
Immigrants from Korea
2.3%
SINGLE FATHER HOUSEHOLDS
48.2/ 100
METRIC RATING
176th/ 347
METRIC RANK
2.0%
SINGLE FATHER HOUSEHOLDS
99.9/ 100
METRIC RATING
54th/ 347
METRIC RANK
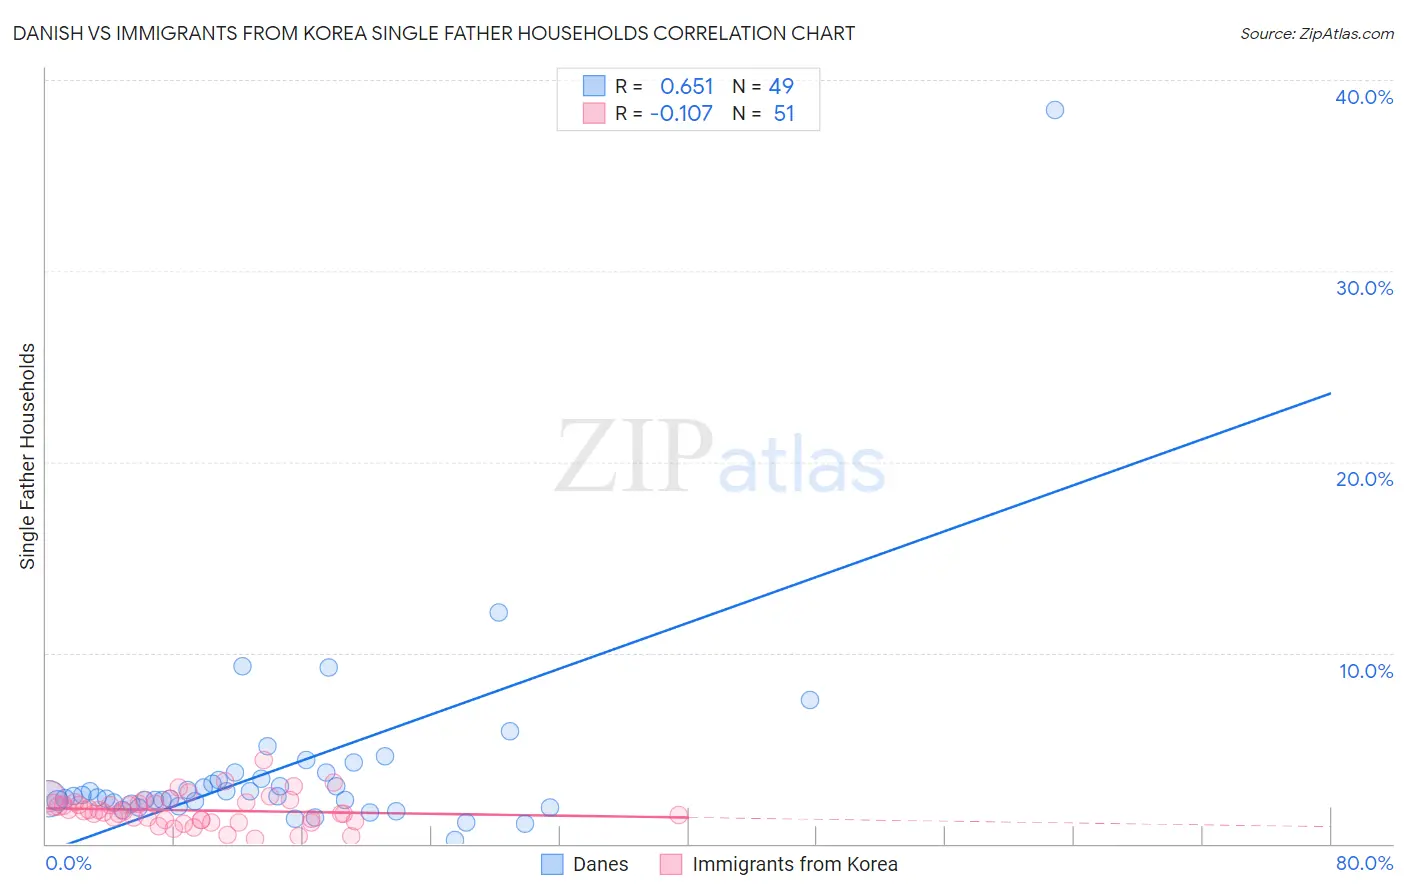
Danish vs Immigrants from Korea Single Father Households Correlation Chart
The statistical analysis conducted on geographies consisting of 466,880,679 people shows a significant positive correlation between the proportion of Danes and percentage of single father households in the United States with a correlation coefficient (R) of 0.651 and weighted average of 2.3%. Similarly, the statistical analysis conducted on geographies consisting of 412,362,512 people shows a poor negative correlation between the proportion of Immigrants from Korea and percentage of single father households in the United States with a correlation coefficient (R) of -0.107 and weighted average of 2.0%, a difference of 15.5%.
Single Father Households Correlation Summary
| Measurement | Danish | Immigrants from Korea |
| Minimum | 0.21% | 0.27% |
| Maximum | 38.5% | 4.4% |
| Range | 38.2% | 4.1% |
| Mean | 3.9% | 1.7% |
| Median | 2.5% | 1.7% |
| Interquartile 25% (IQ1) | 2.1% | 1.2% |
| Interquartile 75% (IQ3) | 3.6% | 2.1% |
| Interquartile Range (IQR) | 1.5% | 0.91% |
| Standard Deviation (Sample) | 5.5% | 0.80% |
| Standard Deviation (Population) | 5.5% | 0.79% |
Similar Demographics by Single Father Households
Demographics Similar to Danes by Single Father Households
In terms of single father households, the demographic groups most similar to Danes are Colombian (2.3%, a difference of 0.010%), Immigrants from Jamaica (2.3%, a difference of 0.060%), Afghan (2.3%, a difference of 0.13%), Costa Rican (2.3%, a difference of 0.31%), and Welsh (2.3%, a difference of 0.31%).
| Demographics | Rating | Rank | Single Father Households |
| Czechs | 62.5 /100 | #169 | Good 2.3% |
| Ugandans | 62.2 /100 | #170 | Good 2.3% |
| Swedes | 61.6 /100 | #171 | Good 2.3% |
| Czechoslovakians | 58.9 /100 | #172 | Average 2.3% |
| Celtics | 55.4 /100 | #173 | Average 2.3% |
| Afghans | 50.0 /100 | #174 | Average 2.3% |
| Immigrants | Jamaica | 49.1 /100 | #175 | Average 2.3% |
| Danes | 48.2 /100 | #176 | Average 2.3% |
| Colombians | 48.0 /100 | #177 | Average 2.3% |
| Costa Ricans | 44.1 /100 | #178 | Average 2.3% |
| Welsh | 44.0 /100 | #179 | Average 2.3% |
| Yugoslavians | 43.9 /100 | #180 | Average 2.3% |
| Jamaicans | 43.5 /100 | #181 | Average 2.3% |
| Belgians | 43.3 /100 | #182 | Average 2.3% |
| Immigrants | Panama | 41.8 /100 | #183 | Average 2.4% |
Demographics Similar to Immigrants from Korea by Single Father Households
In terms of single father households, the demographic groups most similar to Immigrants from Korea are Immigrants from France (2.0%, a difference of 0.050%), Immigrants from Norway (2.0%, a difference of 0.080%), Immigrants from Northern Europe (2.0%, a difference of 0.14%), Immigrants from Europe (2.0%, a difference of 0.28%), and Burmese (2.0%, a difference of 0.34%).
| Demographics | Rating | Rank | Single Father Households |
| Immigrants | Ukraine | 99.9 /100 | #47 | Exceptional 2.0% |
| Immigrants | Kazakhstan | 99.9 /100 | #48 | Exceptional 2.0% |
| Immigrants | Serbia | 99.9 /100 | #49 | Exceptional 2.0% |
| Immigrants | Switzerland | 99.9 /100 | #50 | Exceptional 2.0% |
| Immigrants | Poland | 99.9 /100 | #51 | Exceptional 2.0% |
| Immigrants | Europe | 99.9 /100 | #52 | Exceptional 2.0% |
| Immigrants | Northern Europe | 99.9 /100 | #53 | Exceptional 2.0% |
| Immigrants | Korea | 99.9 /100 | #54 | Exceptional 2.0% |
| Immigrants | France | 99.9 /100 | #55 | Exceptional 2.0% |
| Immigrants | Norway | 99.9 /100 | #56 | Exceptional 2.0% |
| Burmese | 99.9 /100 | #57 | Exceptional 2.0% |
| Immigrants | Czechoslovakia | 99.9 /100 | #58 | Exceptional 2.0% |
| Immigrants | North Macedonia | 99.9 /100 | #59 | Exceptional 2.0% |
| Immigrants | Austria | 99.9 /100 | #60 | Exceptional 2.0% |
| Vietnamese | 99.9 /100 | #61 | Exceptional 2.0% |