African vs Immigrants from Korea Single Father Households
COMPARE
African
Immigrants from Korea
Single Father Households
Single Father Households Comparison
Africans
Immigrants from Korea
2.5%
SINGLE FATHER HOUSEHOLDS
6.3/ 100
METRIC RATING
234th/ 347
METRIC RANK
2.0%
SINGLE FATHER HOUSEHOLDS
99.9/ 100
METRIC RATING
54th/ 347
METRIC RANK
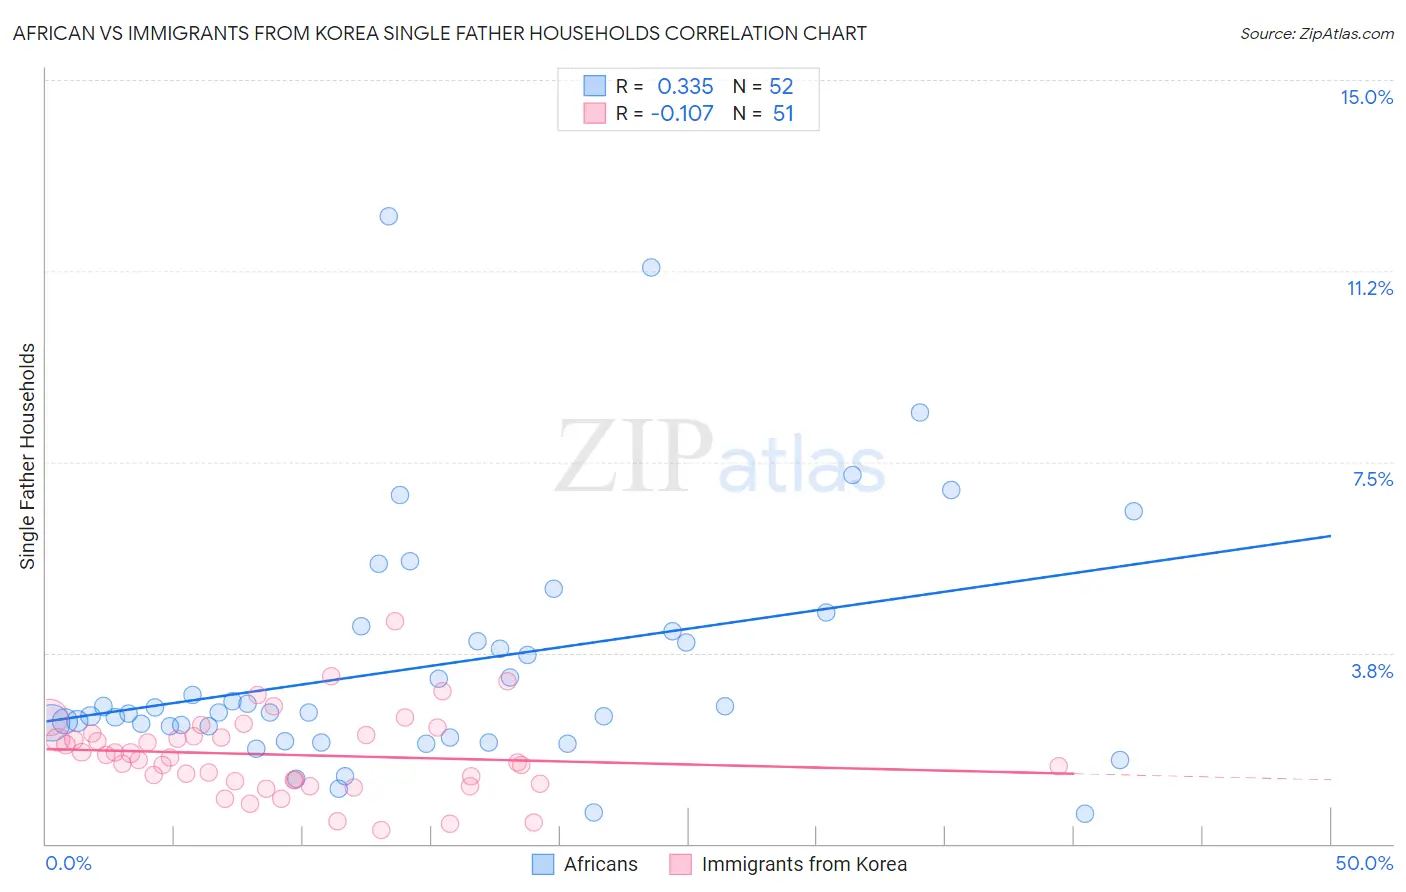
African vs Immigrants from Korea Single Father Households Correlation Chart
The statistical analysis conducted on geographies consisting of 464,994,675 people shows a mild positive correlation between the proportion of Africans and percentage of single father households in the United States with a correlation coefficient (R) of 0.335 and weighted average of 2.5%. Similarly, the statistical analysis conducted on geographies consisting of 412,362,512 people shows a poor negative correlation between the proportion of Immigrants from Korea and percentage of single father households in the United States with a correlation coefficient (R) of -0.107 and weighted average of 2.0%, a difference of 21.1%.
Single Father Households Correlation Summary
| Measurement | African | Immigrants from Korea |
| Minimum | 0.60% | 0.27% |
| Maximum | 12.3% | 4.4% |
| Range | 11.7% | 4.1% |
| Mean | 3.5% | 1.7% |
| Median | 2.6% | 1.7% |
| Interquartile 25% (IQ1) | 2.2% | 1.2% |
| Interquartile 75% (IQ3) | 4.1% | 2.1% |
| Interquartile Range (IQR) | 1.9% | 0.91% |
| Standard Deviation (Sample) | 2.4% | 0.80% |
| Standard Deviation (Population) | 2.4% | 0.79% |
Similar Demographics by Single Father Households
Demographics Similar to Africans by Single Father Households
In terms of single father households, the demographic groups most similar to Africans are Immigrants (2.5%, a difference of 0.020%), Cajun (2.5%, a difference of 0.070%), Sierra Leonean (2.5%, a difference of 0.12%), Immigrants from Sierra Leone (2.5%, a difference of 0.15%), and Immigrants from Oceania (2.5%, a difference of 0.16%).
| Demographics | Rating | Rank | Single Father Households |
| Americans | 9.3 /100 | #227 | Tragic 2.4% |
| Immigrants | Ghana | 9.1 /100 | #228 | Tragic 2.4% |
| Immigrants | Zaire | 8.6 /100 | #229 | Tragic 2.4% |
| Sub-Saharan Africans | 8.3 /100 | #230 | Tragic 2.4% |
| Immigrants | Nonimmigrants | 7.6 /100 | #231 | Tragic 2.4% |
| Pennsylvania Germans | 7.3 /100 | #232 | Tragic 2.4% |
| Immigrants | Western Africa | 7.0 /100 | #233 | Tragic 2.4% |
| Africans | 6.3 /100 | #234 | Tragic 2.5% |
| Immigrants | Immigrants | 6.3 /100 | #235 | Tragic 2.5% |
| Cajuns | 6.1 /100 | #236 | Tragic 2.5% |
| Sierra Leoneans | 5.9 /100 | #237 | Tragic 2.5% |
| Immigrants | Sierra Leone | 5.8 /100 | #238 | Tragic 2.5% |
| Immigrants | Oceania | 5.8 /100 | #239 | Tragic 2.5% |
| Immigrants | Dominica | 4.8 /100 | #240 | Tragic 2.5% |
| Portuguese | 4.1 /100 | #241 | Tragic 2.5% |
Demographics Similar to Immigrants from Korea by Single Father Households
In terms of single father households, the demographic groups most similar to Immigrants from Korea are Immigrants from France (2.0%, a difference of 0.050%), Immigrants from Norway (2.0%, a difference of 0.080%), Immigrants from Northern Europe (2.0%, a difference of 0.14%), Immigrants from Europe (2.0%, a difference of 0.28%), and Burmese (2.0%, a difference of 0.34%).
| Demographics | Rating | Rank | Single Father Households |
| Immigrants | Ukraine | 99.9 /100 | #47 | Exceptional 2.0% |
| Immigrants | Kazakhstan | 99.9 /100 | #48 | Exceptional 2.0% |
| Immigrants | Serbia | 99.9 /100 | #49 | Exceptional 2.0% |
| Immigrants | Switzerland | 99.9 /100 | #50 | Exceptional 2.0% |
| Immigrants | Poland | 99.9 /100 | #51 | Exceptional 2.0% |
| Immigrants | Europe | 99.9 /100 | #52 | Exceptional 2.0% |
| Immigrants | Northern Europe | 99.9 /100 | #53 | Exceptional 2.0% |
| Immigrants | Korea | 99.9 /100 | #54 | Exceptional 2.0% |
| Immigrants | France | 99.9 /100 | #55 | Exceptional 2.0% |
| Immigrants | Norway | 99.9 /100 | #56 | Exceptional 2.0% |
| Burmese | 99.9 /100 | #57 | Exceptional 2.0% |
| Immigrants | Czechoslovakia | 99.9 /100 | #58 | Exceptional 2.0% |
| Immigrants | North Macedonia | 99.9 /100 | #59 | Exceptional 2.0% |
| Immigrants | Austria | 99.9 /100 | #60 | Exceptional 2.0% |
| Vietnamese | 99.9 /100 | #61 | Exceptional 2.0% |