Assyrian/Chaldean/Syriac vs Immigrants from Korea Master's Degree
COMPARE
Assyrian/Chaldean/Syriac
Immigrants from Korea
Master's Degree
Master's Degree Comparison
Assyrians/Chaldeans/Syriacs
Immigrants from Korea
15.8%
MASTER'S DEGREE
86.8/ 100
METRIC RATING
136th/ 347
METRIC RANK
19.7%
MASTER'S DEGREE
100.0/ 100
METRIC RATING
31st/ 347
METRIC RANK
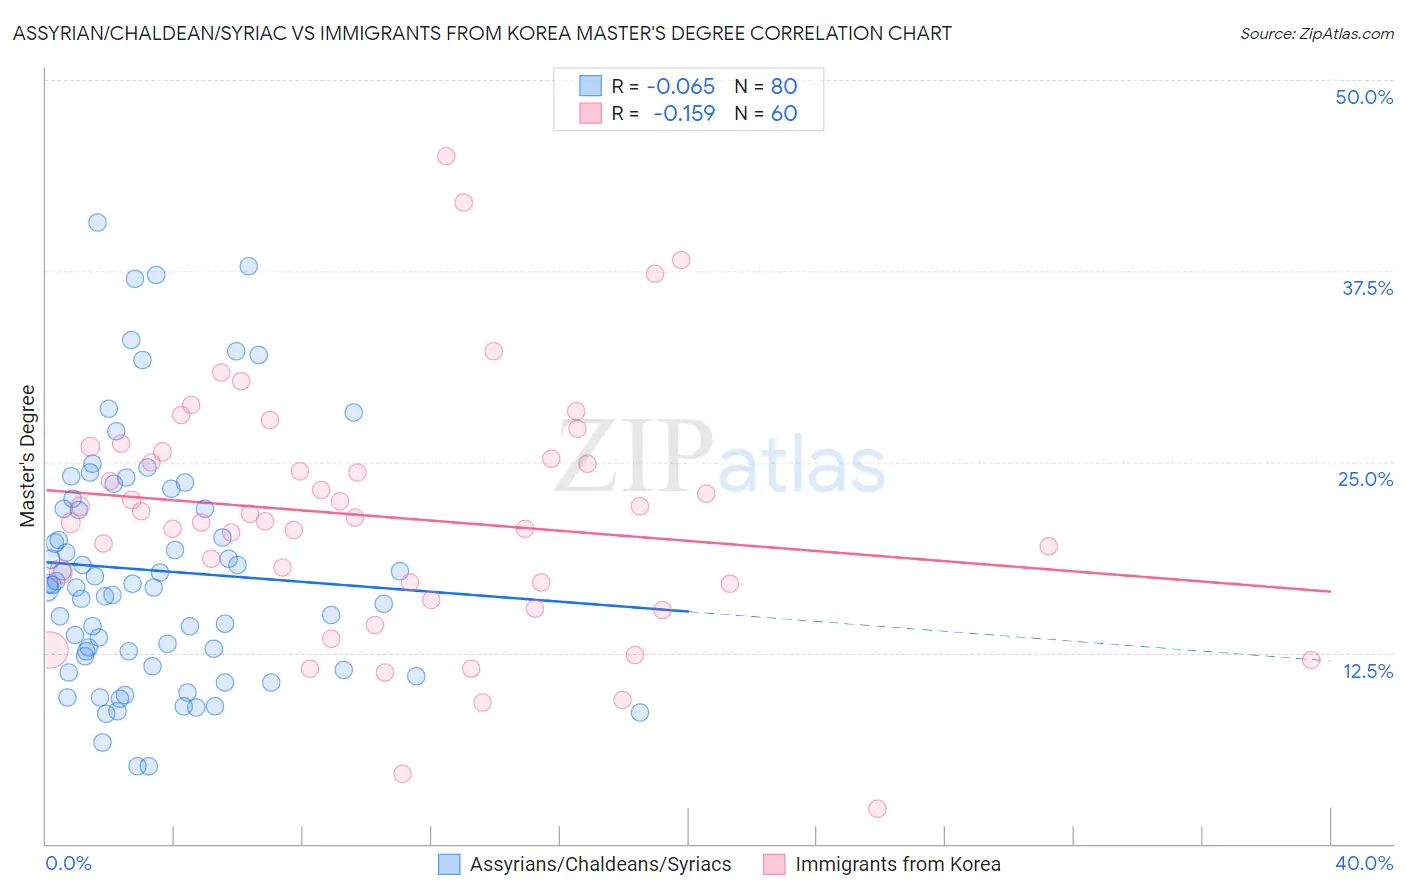
Assyrian/Chaldean/Syriac vs Immigrants from Korea Master's Degree Correlation Chart
The statistical analysis conducted on geographies consisting of 110,306,955 people shows a slight negative correlation between the proportion of Assyrians/Chaldeans/Syriacs and percentage of population with at least master's degree education in the United States with a correlation coefficient (R) of -0.065 and weighted average of 15.8%. Similarly, the statistical analysis conducted on geographies consisting of 416,166,460 people shows a poor negative correlation between the proportion of Immigrants from Korea and percentage of population with at least master's degree education in the United States with a correlation coefficient (R) of -0.159 and weighted average of 19.7%, a difference of 24.6%.
Master's Degree Correlation Summary
| Measurement | Assyrian/Chaldean/Syriac | Immigrants from Korea |
| Minimum | 5.1% | 2.3% |
| Maximum | 40.6% | 45.0% |
| Range | 35.6% | 42.7% |
| Mean | 17.9% | 21.4% |
| Median | 16.9% | 21.2% |
| Interquartile 25% (IQ1) | 11.9% | 16.5% |
| Interquartile 75% (IQ3) | 22.3% | 25.4% |
| Interquartile Range (IQR) | 10.3% | 9.0% |
| Standard Deviation (Sample) | 8.0% | 8.2% |
| Standard Deviation (Population) | 7.9% | 8.1% |
Similar Demographics by Master's Degree
Demographics Similar to Assyrians/Chaldeans/Syriacs by Master's Degree
In terms of master's degree, the demographic groups most similar to Assyrians/Chaldeans/Syriacs are European (15.8%, a difference of 0.10%), Pakistani (15.8%, a difference of 0.18%), Immigrants from Germany (15.8%, a difference of 0.24%), Vietnamese (15.8%, a difference of 0.33%), and Venezuelan (15.9%, a difference of 0.45%).
| Demographics | Rating | Rank | Master's Degree |
| Immigrants | Syria | 93.3 /100 | #129 | Exceptional 16.2% |
| Immigrants | Jordan | 92.7 /100 | #130 | Exceptional 16.1% |
| Taiwanese | 91.9 /100 | #131 | Exceptional 16.1% |
| Serbians | 91.7 /100 | #132 | Exceptional 16.1% |
| Immigrants | Sudan | 90.2 /100 | #133 | Exceptional 16.0% |
| Venezuelans | 88.4 /100 | #134 | Excellent 15.9% |
| South American Indians | 88.4 /100 | #135 | Excellent 15.9% |
| Assyrians/Chaldeans/Syriacs | 86.8 /100 | #136 | Excellent 15.8% |
| Europeans | 86.4 /100 | #137 | Excellent 15.8% |
| Pakistanis | 86.1 /100 | #138 | Excellent 15.8% |
| Immigrants | Germany | 85.9 /100 | #139 | Excellent 15.8% |
| Vietnamese | 85.5 /100 | #140 | Excellent 15.8% |
| Poles | 85.0 /100 | #141 | Excellent 15.7% |
| Immigrants | Africa | 84.0 /100 | #142 | Excellent 15.7% |
| Immigrants | Venezuela | 83.6 /100 | #143 | Excellent 15.7% |
Demographics Similar to Immigrants from Korea by Master's Degree
In terms of master's degree, the demographic groups most similar to Immigrants from Korea are Immigrants from Turkey (19.7%, a difference of 0.010%), Burmese (19.7%, a difference of 0.070%), Latvian (19.8%, a difference of 0.52%), Russian (19.5%, a difference of 0.85%), and Immigrants from Denmark (19.5%, a difference of 0.88%).
| Demographics | Rating | Rank | Master's Degree |
| Immigrants | Sweden | 100.0 /100 | #24 | Exceptional 20.3% |
| Immigrants | Japan | 100.0 /100 | #25 | Exceptional 20.0% |
| Cambodians | 100.0 /100 | #26 | Exceptional 20.0% |
| Immigrants | Sri Lanka | 100.0 /100 | #27 | Exceptional 19.9% |
| Turks | 100.0 /100 | #28 | Exceptional 19.9% |
| Latvians | 100.0 /100 | #29 | Exceptional 19.8% |
| Immigrants | Turkey | 100.0 /100 | #30 | Exceptional 19.7% |
| Immigrants | Korea | 100.0 /100 | #31 | Exceptional 19.7% |
| Burmese | 100.0 /100 | #32 | Exceptional 19.7% |
| Russians | 100.0 /100 | #33 | Exceptional 19.5% |
| Immigrants | Denmark | 100.0 /100 | #34 | Exceptional 19.5% |
| Immigrants | Northern Europe | 100.0 /100 | #35 | Exceptional 19.5% |
| Immigrants | Russia | 100.0 /100 | #36 | Exceptional 19.4% |
| Mongolians | 100.0 /100 | #37 | Exceptional 19.4% |
| Bolivians | 100.0 /100 | #38 | Exceptional 19.3% |